

1.已经确定研究的基因,但是想探索他潜在的功能,可以通过跟这个基因表达最相关的基因来反推他的功能,这种方法在英语中称为guilt of association,协同犯罪。
2.我们的注释方法依赖于TCGA大样本,既然他可以注释基因,那么任何跟肿瘤相关的基因都可以被注释,包括长链非编码RNA
下面操作开始:
1.加载已经整理好的癌症数据
load(file = "exprSet_arrange.Rdata")
exprSet[1:3,1:3]
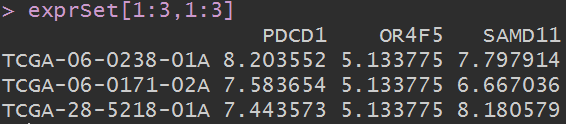
这个数据依然是行是样本,列是基因。
2.批量相关性分析
将第一行目的基因跟其他行的编码基因批量做相关性分析,得到相关性系数以及p值 需要大概30s左右的时间。
y <- as.numeric(exprSet[,"PDCD1"])
colnames <- colnames(exprSet)
cor_data_df <- data.frame(colnames)
for (i in 1:length(colnames)){
test <- cor.test(as.numeric(exprSet[,i]),y,type="spearman")
cor_data_df[i,2] <- test$estimate
cor_data_df[i,3] <- test$p.value
}
names(cor_data_df) <- c("symbol","correlation","pvalue")
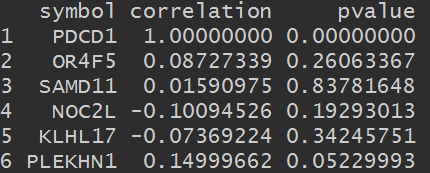
查看这个数据结构
head(cor_data_df)
3.筛选最相关的基因
筛选p值小于0.05,按照相关性系数绝对值选前500个的基因, 数量可以自己定
library(dplyr)
library(tidyr)
cor_data_sig <- cor_data_df %>%
filter(pvalue < 0.05) %>%
arrange(desc(abs(correlation)))%>%
dplyr::slice(1:500)
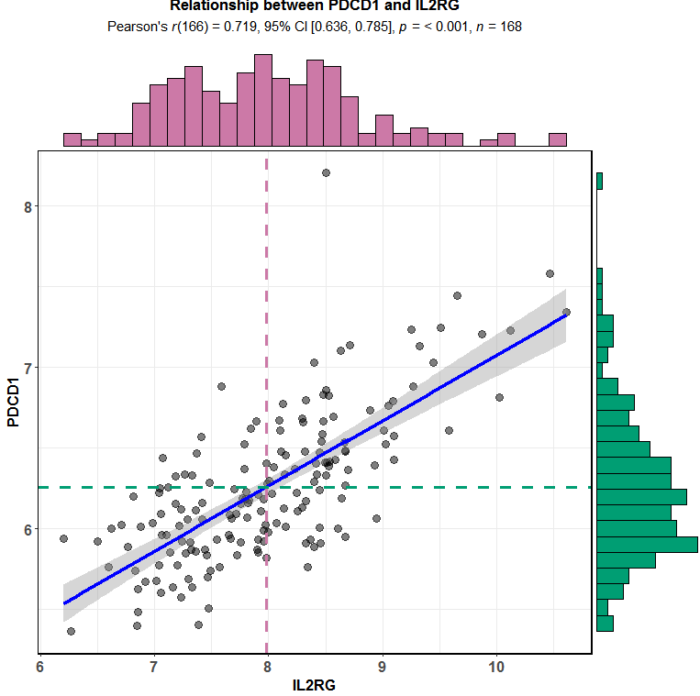
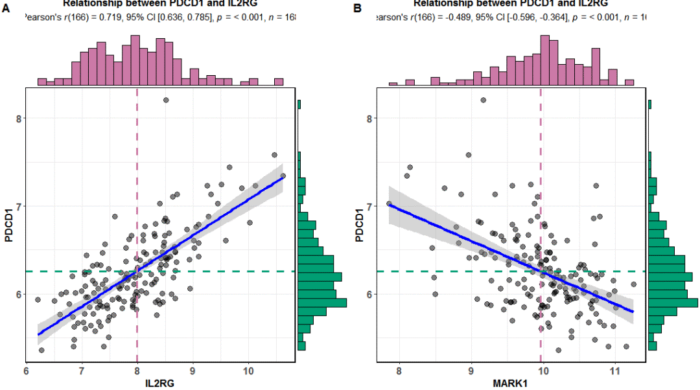
4.随机选取正的和负的分别作图验证
用到的方法在以前的图有毒系列里面图有毒系列之二
正相关的选取IL2RG
library(ggstatsplot)
ggscatterstats(data = exprSet,
y = PDCD1,
x = IL2RG,
centrality.para = "mean",
margins = "both",
xfill = "#CC79A7",
yfill = "#009E73",
marginal.type = "histogram",
title = "Relationship between PDCD1 and IL2RG")
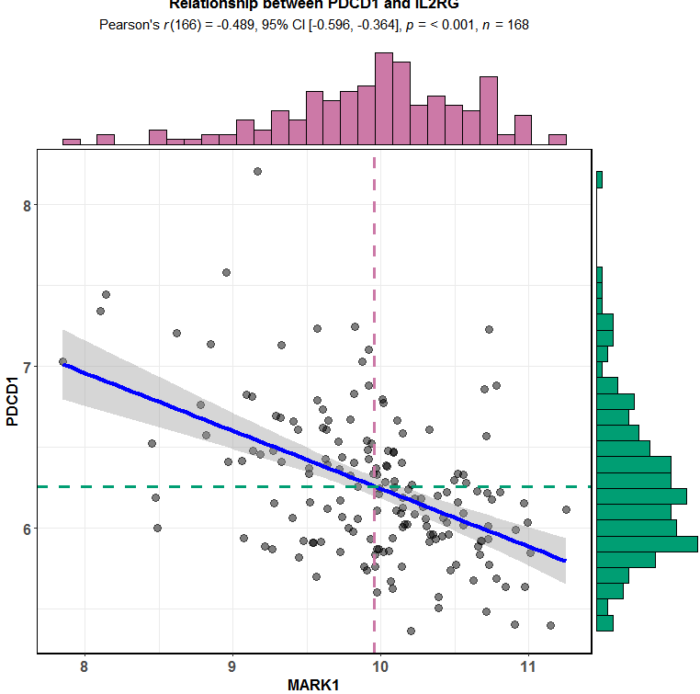
负相关的选取MARK1
library(ggstatsplot)
ggscatterstats(data = exprSet,
y = PDCD1,
x = MARK1,
centrality.para = "mean",
margins = "both",
xfill = "#CC79A7",
yfill = "#009E73",
marginal.type = "histogram",
title = "Relationship between PDCD1 and IL2RG")
我们还可以用cowplot拼图
library(cowplot)
p1 <- ggscatterstats(data = exprSet,
y = PDCD1,
x = IL2RG,
centrality.para = "mean",
margins = "both",
xfill = "#CC79A7",
yfill = "#009E73",
marginal.type = "histogram",
title = "Relationship between PDCD1 and IL2RG")p2 <- ggscatterstats(data = exprSet,
y = PDCD1,
x = MARK1,
centrality.para = "mean",
margins = "both",
xfill = "#CC79A7",
yfill = "#009E73",
marginal.type = "histogram",
title = "Relationship between PDCD1 and IL2RG")plot_grid(p1,p2,nrow = 1,labels = LETTERS[1:2])
5.下面进行聚类分析
既然确定了相关性是正确的,那么我们用我们筛选的基因进行富集分析就可以反推这个基因的功能
library(clusterProfiler)
#获得基因列表
library(stringr)
gene <- str_trim(cor_data_sig$symbol,'both')
#基因名称转换,返回的是数据框
gene = bitr(gene, fromType="SYMBOL", toType="ENTREZID", OrgDb="org.Hs.eg.db")
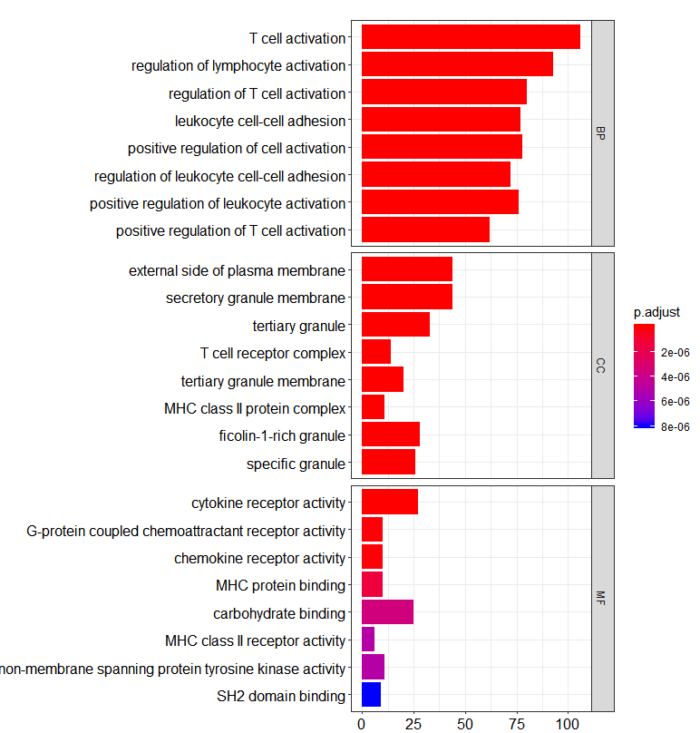
go <- enrichGO(gene = gene$ENTREZID, OrgDb = "org.Hs.eg.db", ont="all")
这里因为是计算的所有GO分析的三个分类,所以可以合并作图
这是条形图
barplot(go, split="ONTOLOGY") facet_grid(ONTOLOGY~., scale="free")
这是气泡图
dotplot(go, split="ONTOLOGY") facet_grid(ONTOLOGY~., scale="free")
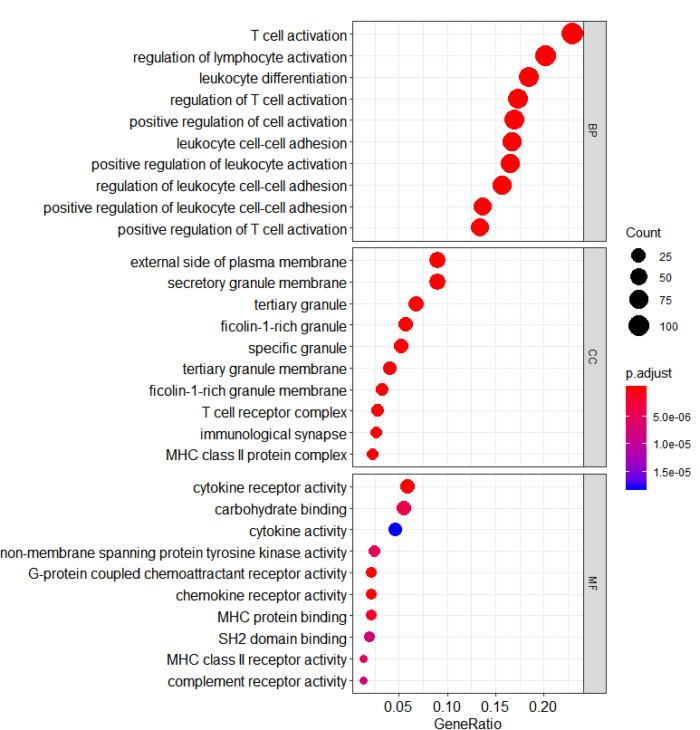
这时候,我们能推断PDCD1这个基因主要参与T细胞激活,细胞因子受体活性调剂等功能,大致跟她本身的功能是一致的。
这种方法,即使是非编码基因也可以注释出来,想到长链非编码基因的数量。