

在分析scRNA-seq数据之前,我们必须确保所有细胞barcode均与活细胞相对应。通常基于三个QC协变量执行细胞QC(Quality control):
- 每个barcode的数量
- 每个barcode对应的基因数量
- 每个barcode的数量中线粒体基因的占比
通过这些QC协变量的分布图,可以通过阈值过滤掉离群峰。
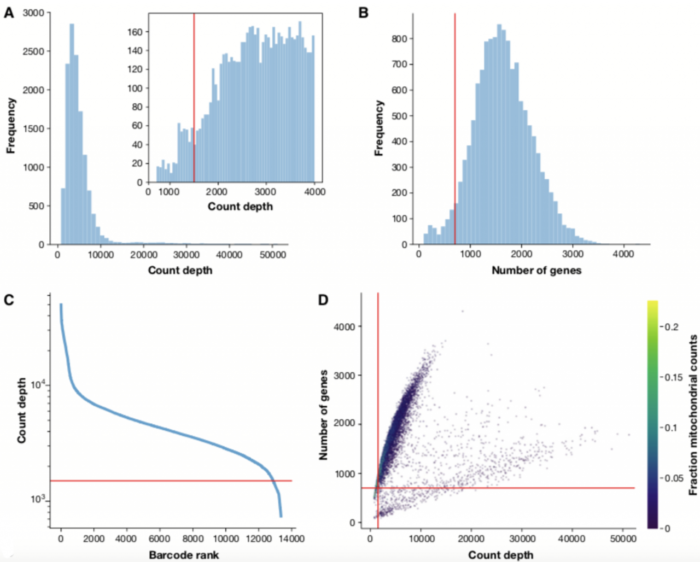
这些异常的barcodes对应着:
- 死细胞
- 细胞膜破损的细胞
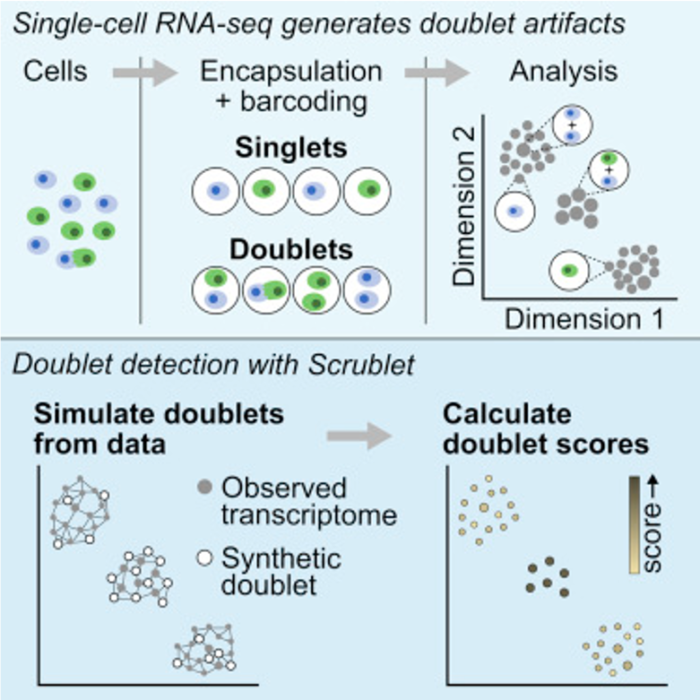
- 双细胞(doublets)
例如,barcodes计数深度低,检测到的基因很少且线粒体计数高,这表明细胞的细胞质mRNA已通过破膜渗出,因此,仅位于线粒体中的mRNA仍然在细胞内。相反,具有非预期高计数和检测到大量基因的细胞可能代表双细胞。
检测scRNA-seq中双细胞的分析鉴定工具总结了以下几种:
- scrublet (python)
- DoubletDetection (python)
- DoubletDecon (R)
- DoubletFinder (R)
这些双细胞的分析鉴定工具在2019年发表的《单细胞数据分析最佳实践》中也有推荐(Luecken M D et al, 2019)
本期将对
scrublet的使用做一个详细介绍
scrublet的使用
scrublet文献:Wolock S L, Lopez R, Klein A M. Scrublet: computational identification of cell doublets in single-cell transcriptomic data[J]. Cell systems, 2019, 8(4): 281-291. e9. scrublet教程参考来源链接
安装
scrublet为python语言编写的包,用以下pip命令安装就可以。
pip install scrublet
使用注意事项
处理来自多个样本的数据时,请分别对每个样本运行Scrublet。 因为Scrublet旨在检测由两个细胞的随机共封装形成的technical doublets,所以在merged数据集上可能会表现不佳,因为细胞类型比例不代表任何单个样品;检查doublet score阈值是否合理,并在必要时进行手动调整。并不是所有情况向下doublet score的直方分布图都是呈现标准的双峰;UMAP或t-SNE可视化的结果中,预测的双细胞应该大体上共定位(可能在多个细胞群中)。 如果不是,则可能需要调整doublet score阈值,或更改预处理参数以更好地解析数据中存在的细胞状态。
准备工作
数据准备
下载来自10X Genomics8k的PBMC数据集并解压。
wget http://cf.10xgenomics.com/samples/cell-exp/2.1.0/pbmc8k/pbmc8k_filtered_gene_bc_matrices.tar.gz
tar xfz pbmc8k_filtered_gene_bc_matrices.tar.gz
numpy兼容性报错修复
高版本numpy带来的cannot import name '_validate_lenghs'报错修复方案
scrublet包的开发依赖的是比较低版本的numpy,会用到arraypad.py中的_validate_lenghs函数,这个函数在比较高的numpy版本中已经弃用,如果安装的是高版本numpy,可能在运行scrublet时会有报错导致中断:cannot import name '_validate_lenghs'。
考虑到一般其他软件包依赖高版本numpy的情况比较多,不想再降低numpy的版本,所以让scrublet能够运行下去的修复方案为如下:
打开终端,进入Python环境,输入以下代码,查看Python安装位置。
import sys
print(sys.path)
找到arraypad.py的位置 ~/anaconda3/lib/python3.6/site-packages/numpy/lib/arraypad.py,打开文件,在文件最后添加以下代码,保存退出,问题解决。
def _normalize_shape(ndarray, shape, cast_to_int=True):
    """
    Private function which does some checks and normalizes the possibly
    much simpler representations of ‘pad_width‘, ‘stat_length‘,
    ‘constant_values‘, ‘end_values‘.

    Parameters
    ----------
    narray : ndarray
        Input ndarray
    shape : {sequence, array_like, float, int}, optional
        The width of padding (pad_width), the number of elements on the
        edge of the narray used for statistics (stat_length), the constant
        value(s) to use when filling padded regions (constant_values), or the
        endpoint target(s) for linear ramps (end_values).
        ((before_1, after_1), ... (before_N, after_N)) unique number of
        elements for each axis where `N` is rank of `narray`.
        ((before, after),) yields same before and after constants for each
        axis.
        (constant,) or val is a shortcut for before = after = constant for
        all axes.
    cast_to_int : bool, optional
        Controls if values in ``shape`` will be rounded and cast to int
        before being returned.

    Returns
    -------
    normalized_shape : tuple of tuples
        val                               => ((val, val), (val, val), ...)
        [[val1, val2], [val3, val4], ...] => ((val1, val2), (val3, val4), ...)
        ((val1, val2), (val3, val4), ...) => no change
        [[val1, val2], ]                  => ((val1, val2), (val1, val2), ...)
        ((val1, val2), )                  => ((val1, val2), (val1, val2), ...)
        [[val ,     ], ]                  => ((val, val), (val, val), ...)
        ((val ,     ), )                  => ((val, val), (val, val), ...)

    """
    ndims = ndarray.ndim

    # Shortcut shape=None
    if shape is None:
        return ((None, None), ) * ndims

    # Convert any input `info` to a NumPy array
    shape_arr = np.asarray(shape)

    try:
        shape_arr = np.broadcast_to(shape_arr, (ndims, 2))
    except ValueError:
        fmt = "Unable to create correctly shaped tuple from %s"
        raise ValueError(fmt % (shape,))

    # Cast if necessary
    if cast_to_int is True:
        shape_arr = np.round(shape_arr).astype(int)

    # Convert list of lists to tuple of tuples
    return tuple(tuple(axis) for axis in shape_arr.tolist())


def _validate_lengths(narray, number_elements):
    """
    Private function which does some checks and reformats pad_width and
    stat_length using _normalize_shape.

    Parameters
    ----------
    narray : ndarray
        Input ndarray
    number_elements : {sequence, int}, optional
        The width of padding (pad_width) or the number of elements on the edge
        of the narray used for statistics (stat_length).
        ((before_1, after_1), ... (before_N, after_N)) unique number of
        elements for each axis.
        ((before, after),) yields same before and after constants for each
        axis.
        (constant,) or int is a shortcut for before = after = constant for all
        axes.

    Returns
    -------
    _validate_lengths : tuple of tuples
        int                               => ((int, int), (int, int), ...)
        [[int1, int2], [int3, int4], ...] => ((int1, int2), (int3, int4), ...)
        ((int1, int2), (int3, int4), ...) => no change
        [[int1, int2], ]                  => ((int1, int2), (int1, int2), ...)
        ((int1, int2), )                  => ((int1, int2), (int1, int2), ...)
        [[int ,     ], ]                  => ((int, int), (int, int), ...)
        ((int ,     ), )                  => ((int, int), (int, int), ...)

    """
    normshp = _normalize_shape(narray, number_elements)
    for i in normshp:
        chk = [1 if x is None else x for x in i]
        chk = [1 if x >= 0 else -1 for x in chk]
        if (chk[0] < 0) or (chk[1] < 0):
            fmt = "%s cannot contain negative values."
            raise ValueError(fmt % (number_elements,))
    return normshp
scrublet使用教程
我的测试执行环境是MACOS jupyter notebook,以下代码为python包的载入和画图设置:
%matplotlib inline
import scrublet as scr
import scipy.io
import matplotlib.pyplot as plt
import numpy as np
import os
import pandas as pd

plt.rcParams['font.family'] = 'sans-serif'
plt.rcParams['font.sans-serif'] = 'Arial'
plt.rc('font', size=14)
plt.rcParams['pdf.fonttype'] = 42
读入10X的scRNA-seq矩阵,读入raw counts矩阵为scipy sparse矩阵,cells作为行,genes作为列:
input_dir = '/Users/yuanzan/Desktop/doublets/filtered_gene_bc_matrices/GRCh38/'
counts_matrix = scipy.io.mmread(input_dir   '/matrix.mtx').T.tocsc()
genes = np.array(scr.load_genes(input_dir   '/genes.tsv', delimiter='t', column=1))
out_df = pd.read_csv(input_dir   '/barcodes.tsv', header = None, index_col=None, names=['barcode'])


print('Counts matrix shape: {} rows, {} columns'.format(counts_matrix.shape[0], counts_matrix.shape[1]))
print('Number of genes in gene list: {}'.format(len(genes)))
Counts matrix shape: 8381 rows, 33694 columns Number of genes in gene list: 33694
初始化Scrublet对象
相关参数为: * expected_doublet_rate,doublets的预期占比,通常为0.05-0.1,结果对该参数不是特别敏感。 对于此示例数据,预期的doublets占比来自Chromium用户指南 * sim_doublet_ratio,要模拟的doublets数量相对于转录组的观测值的比例。此值应该足够高,以使所有的doublet状态都能很好地由模拟doublets表示。设置得太高会使计算量增大,默认值是2(尽管设置低至0.5的值也对测试的数据集产生非常相似的结果。 * n_neighbors,用于构造转录组观测值和模拟doublets的KNN分类器的邻居数。 默认值为round(0.5 * sqrt(n_cells)),通常表现比较好。
scrub = scr.Scrublet(counts_matrix, expected_doublet_rate=0.06)
计算doublet score
运行下面的代码计算doublet score,内部处理过程包括:
- Doublet simulation
- Normalization, gene filtering, rescaling, PCA
- Doublet score calculation
- Doublet score threshold detection and doublet calling
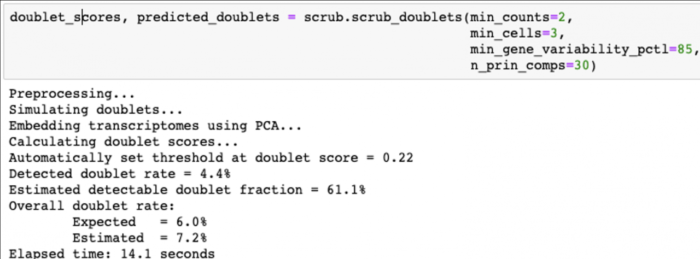
doublet_scores, predicted_doublets = scrub.scrub_doublets(min_counts=2, min_cells=3, min_gene_variability_pctl=85, n_prin_comps=30)
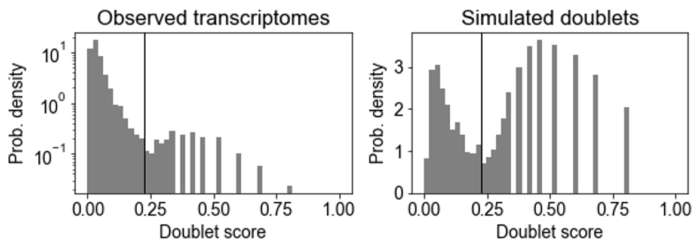
绘制doublet score分布直方图
Doublet score分布直方图包括观察到的转录组和模拟的doublet,模拟的doublet直方图通常是双峰的。
- 下面
左图模式对应于由具有相似基因表达的两个细胞产生的"embedded" doublets; 右图模式对应"neotypic" doublets,由具有不同基因表达的细胞(例如,不同类型的细胞)产生,这些会在下游分析中引入更多的假象。Scrublet只能检测"neotypic" doublets。
要call doublets vs. singlets,我们必须设置一个doublet score阈值,理想情况下,阈值应在模拟doublet直方图的两种模式之间设置最小值。scrub_doublets()函数尝试自动识别这一点,在这个测试数据示例中表现比较好。如果自动阈值检测效果不佳,则可以使用call_doublets()函数调整阈值,例如:
scrub.call_doublets(threshold=0.25)
# 画doublet score直方图
scrub.plot_histogram()
降维可视化
降维计算
这个示例采用UMAP降维,还有tSNE可选,作者不推荐用tSNE,因为运行比较慢。
print('Running UMAP...')
scrub.set_embedding('UMAP', scr.get_umap(scrub.manifold_obs_, 10, min_dist=0.3))
print('Done.')
UMAP可视化
scrub.plot_embedding('UMAP', order_points=True)
下面左图黑色的点为预测的doublets。
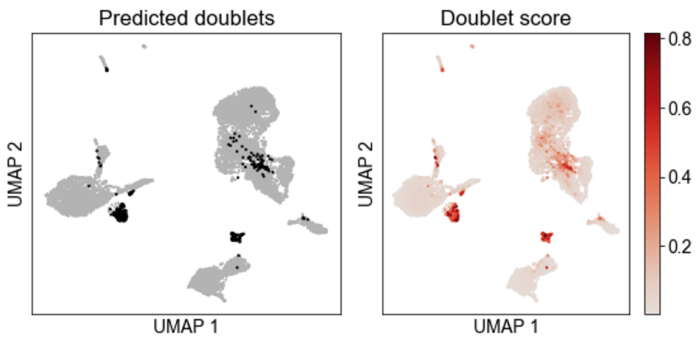
# doublets占比
print (scrub.detected_doublet_rate_)
# 0.043789523923159525
把doublets预测结果保存到文件,后续用Seurat等软件处理的时候可以导入doublets的预测结果对barcode进行筛选。
out_df['doublet_scores'] = doublet_scores
out_df['predicted_doublets'] = predicted_doublets
out_df.to_csv(input_dir   '/doublet.txt', index=False,header=True)
out_df.head()
| barcode | doublet_scores | predicted_doublets |
|---|---|---|
| AAACCTGAGCATCATC-1 | 0.020232985898221900 | FALSE |
| AAACCTGAGCTAACTC-1 | 0.009746972531259230 | FALSE |
| AAACCTGAGCTAGTGG-1 | 0.013493253373313300 | FALSE |
| AAACCTGCACATTAGC-1 | 0.087378640776699 | FALSE |
| AAACCTGCACTGTTAG-1 | 0.02405046655276650 | FALSE |
| AAACCTGCATAGTAAG-1 | 0.03969184391224250 | FALSE |
| AAACCTGCATGAACCT-1 | 0.030082836796977200 | FALSE |