

相关参数来控制,它们有
| 参数 | 描述 |
| main | 主标题 |
| sub | 副标题 |
| xlab | x轴标记 |
| ylab | y轴标记 |
| xlim | x轴上下限(范围) |
| ylim | y轴上下限 |
| mgp | 坐标轴标记,坐标字符,坐标刻度线距离坐标轴的行数,默认值为c(3,1,0) |
增加一个新的坐标轴使用axis()函数。
| 参数 | 描述 |
| side | 坐标轴所在的位置,1:下,2:左,3:上,4:右 |
| at | 坐标轴具体位置,通常由自动给出。 |
| labels | 坐标字符串 |
| pos | 坐标轴线所在的行,默认值为重绘所在位置上的原坐标 |
| lty | 线型 |
| col | 颜色 |
| las | 坐标标记与坐标轴方位关系,=0为平等,=2为垂直 |
| lwd.ticks | 坐标刻度线宽度 |
| col.ticks | 坐标刻度线颜色 |
| (…) | 其它par()中可用的参数 |
> # A Silly Axis Example
>
> # specify the data
> x <- c(1:10); y <- x; z <- 10/x
>
> # create extra margin room on the right for an axis
> par(mar=c(5, 4, 4, 8) + 0.1)
>
> # plot x vs. y
> plot(x, y,type="b", pch=21, col="red",
+    yaxt="n", lty=3, xlab="", ylab="")
>
> # add x vs. 1/x
> lines(x, z, type="b", pch=22, col="blue", lty=2)
>
> # draw an axis on the left
> axis(2, at=x,labels=x, col.axis="red", las=2)
>
> # draw an axis on the right, with smaller text and ticks
> axis(4, at=z,labels=round(z,digits=2),
+   col.axis="blue", las=2, cex.axis=0.7, tck=-.01)
>
> # add a title for the right axis
> mtext("y=1/x", side=4, line=3, cex.lab=1,las=2, col="blue")
>
> # add a main title and bottom and left axis labels
> title("An Example of Creative Axes", xlab="X values",
+ ylab="Y=X") |
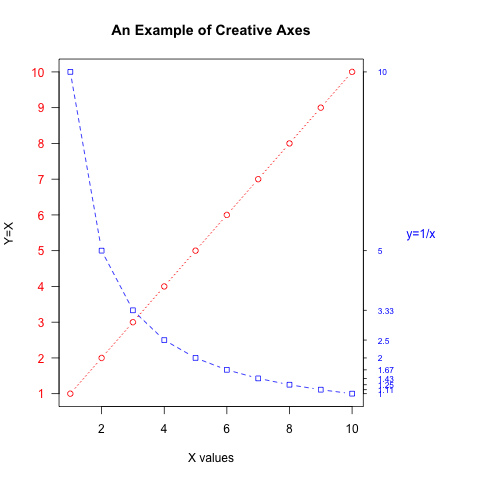
坐标轴
图例使用legend()函数控制
| 参数 | 描述 |
| x,y | 图例所在位置,可以使用"bottom", "bottomleft", "left", "topleft" ,"top", "topright" ,"right" ,"bottomleft", "center"来指定。 |
| inset | 设置在主绘图边距 |
| title | 图例的标题 |
| legend | 图例的内容 |
| … | 其它par()可用的参数 |
> attach(mtcars)
> boxplot(mpg~cyl, main="Milage by Car Weight",
+   	 yaxt="n", xlab="Milage", horizontal=TRUE,
+    col=terrain.colors(3))
> legend("topright", inset=.05, title="Number of Cylinders",
+ c("4","6","8"), fill=terrain.colors(3), horiz=TRUE) |
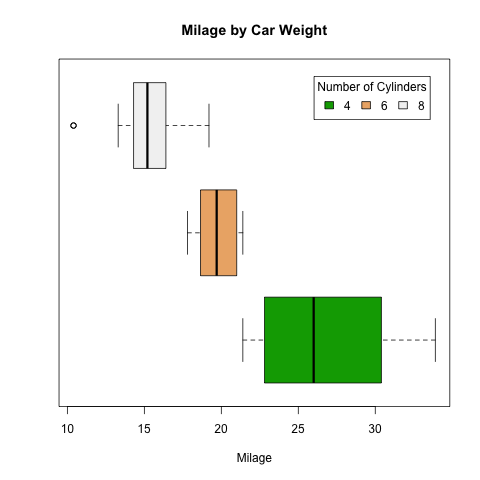
图例
文本框使用text或者mtext函数。text可以在主绘图区内加文本框,mtext在边距或者外边距上加文本框。
text(location, “text to place”, pos, …)
mtext(“text to place”, side, line=n, …)
| 参数 | 描述 |
| location | 图例所在位置 |
| pos | 所在的相对位置,1:下面,2:左边,3:上面,4:右边 |
| side | 所在边距的位置,1:下,2:左,3:上,4:右 |
| … | 其它par()可用的参数 |
> attach(mtcars) > plot(wt, mpg, main="Milage vs. Car Weight", + xlab="Weight", ylab="Mileage", pch=18, col="blue") > text(wt, mpg, row.names(mtcars), cex=0.6, pos=4, col="red") |
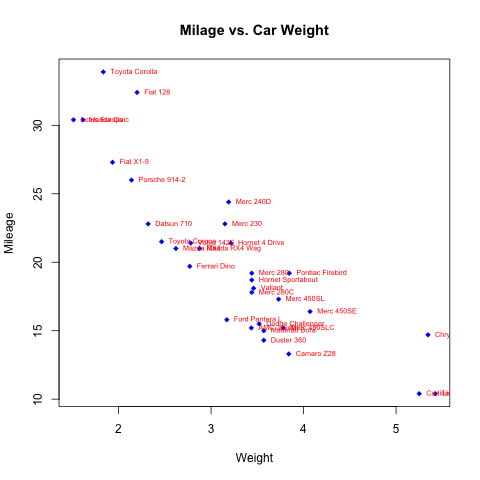
文本框