

画图中的符号由pch参数来控制。其描边色由col控制,填充色由bg控制。
> pchShow <-
+   function(extras = c("*",".", "o","O","0","+","-","|","%","#"),
+            cex = 3, ## good for both .Device=="postscript" and "x11"
+            col = "red3", bg = "gold", coltext = "brown", cextext = 1.2,
+            main = paste("plot symbols :  points (...  pch = *, cex =",
+                         cex,")"))
+   {
+     nex <- length(extras)
+     np  <- 26 + nex
+     ipch <- 0:(np-1)
+     k <- floor(sqrt(np))
+     dd <- c(-1,1)/2
+     rx <- dd + range(ix <- ipch %/% k)
+     ry <- dd + range(iy <- 3 + (k-1)- ipch %% k)
+     pch <- as.list(ipch) # list with integers & strings
+     if(nex > 0) pch[26+ 1:nex] <- as.list(extras)
+     plot(rx, ry, type="n", axes = FALSE, xlab = "", ylab = "",
+          main = main)
+     abline(v = ix, h = iy, col = "lightgray", lty = "dotted")
+     for(i in 1:np) {
+       pc <- pch[[i]]
+       ## 'col' symbols with a 'bg'-colored interior (where available) :
+       points(ix[i], iy[i], pch = pc, col = col, bg = bg, cex = cex)
+       if(cextext > 0)
+           text(ix[i] - 0.3, iy[i], pc, col = coltext, cex = cextext)
+     }
+   }
>
> pchShow() |
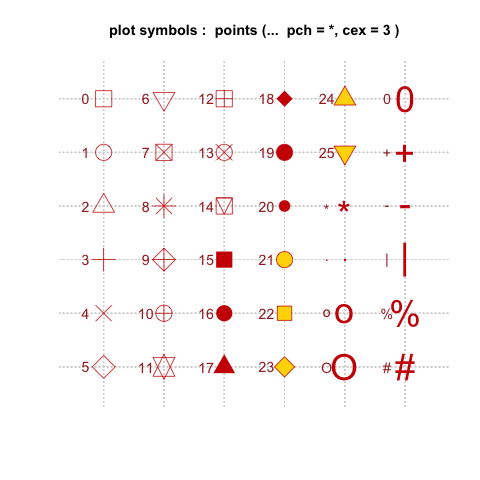
符号
线形主要由lty和lwd来控制。lty: line type. lwd: line width.顾名思意,lty控制线的形状,而lwd控制线的粗细,默认值为1。设计成2表示两倍线宽。
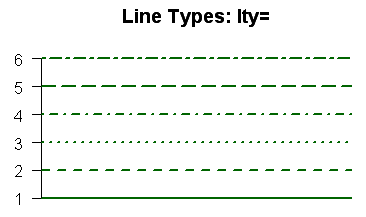
线形