

在数据进行分析时,我们往往需要先看一下数据的基本信息,比如求和、平均数、标准差、标准误、中位数、四分位数、最小值、最大值、极差、偏度、峰度等。在R中这不是难事,有N多的程序包函数可以实现这些功能,有时候你会觉得多得都不知道选择哪一个。本文只介绍两个,一个是基础安装summary{base},另外一个是stat.desc{pastecs},同时会用到分组计算输出函数by()。
library(foreign)
ma<- read.dta("D:/Temp/STATA/Multivariate.dta")
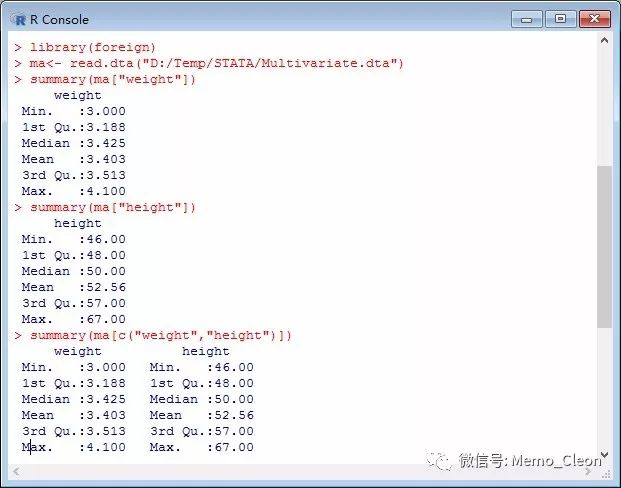
如果不考虑分组,想知道16例受试者体重和身高的一些基本信息,可使用命令:
summary(ma["weight"])
summary(ma["height"])
var=c("weight","height")
summary(ma[var])
summary(ma[c("weight","height")]) #等同于使用命令summary(ma[3:4])或summary(ma[-1:-2])
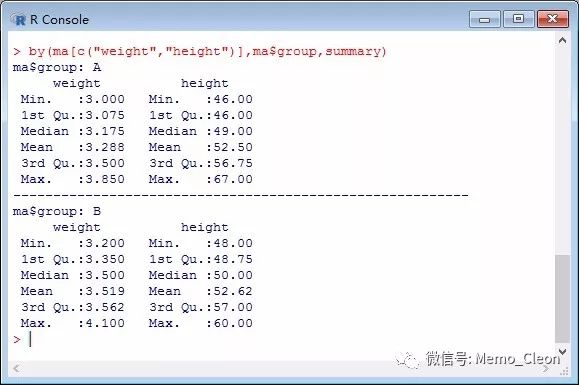
以上只为演示,实际工作中我们想知道的是A、B两组各自的基本信息,这就需要分组计算。函数by {base}:Apply a Function to a Data Frame Split by Factors,应用格式为by(data, INDICES, FUN, ..., simplify = TRUE),具体解释可通过命令help("by")查询,该函数可以按照INDICES将要分析的data数据分割成几个数据框,然后对每个数据框应用FUN函数的功能。
本例分组计算输出命令代码如下:
by(ma[c("weight","height")],ma$group,summary) #对数据框ma中的weight和height变量按group分组,分别进行summary获取描述统计量后输出结果
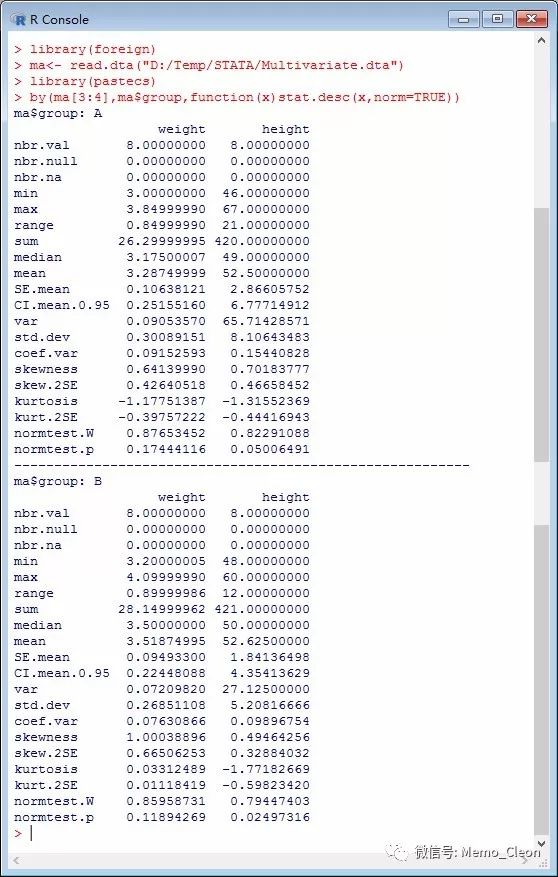
【2】stat.desc{pastecs}
stat.desc(x, basic=TRUE, desc=TRUE, norm=FALSE, p=0.95),这是一个比较牛X的函数,会得出比较多的描述性指标。x为数据框或时间序列,在默认情况下(basic=TRUE, desc=TRUE),函数会返回x所有值、空值、缺失值的数量,最小值,最大值,值域,总和,中位数,平均数,平均数的标准误,均数在P水平时的置信区间,方差,标准差以及变异系数。若norm=TRUE(默认是FALSE),返回正态分布的一些统计量,如偏度和峰度(以及它们的统计显著程度)和Shapiro-Wilk正态检验结果。P=0.95,是默认的置信度为0.95来计算平均数的置信区间。
命令接前面的数据载入命令:
library(pastecs) #载入程序包pastecs,该程序包非默认,需要通过install.packages("pastecs")下载安装
stat.desc(ma[3:4],norm=TRUE,p=0.95)
stat.desc(ma[1:8,3],norm=TRUE) #weightA
stat.desc(ma[9:16,”weight”],norm=TRUE) #weightB
stat.desc(ma[1:8,”height”],norm=TRUE) #heightA
stat.desc(ma[9:16,4],norm=TRUE) #heightB
by(ma[3:4],ma$group,stat.desc) #对数据框ma中的第3列和第4列变量按group分组,分别进行stat.desc获取描述统计量后输出结果
by(ma[3:4],ma$group,function(x)stat.desc(x,norm=TRUE)) #对数据框ma中的第3列和第4列变量按group分组,分别进行stat.desc获取基本描述统计量和正态分布的统计量后输出结果
stat.desc{pastecs}:Descriptive statistics on a data frame or time series。Compute a table giving various descriptive statistics about the series in a data frame or in a single/multiple time series
Useage:stat.desc(x, basic=TRUE, desc=TRUE, norm=FALSE, p=0.95)
x:a data frame or a time series
basic:do we have to return basic statistics (by default, it is TRUE)? These are: the number of values (nbr.val), the number of null values (nbr.null), the number of missing values (nbr.na), the minimal value (min), the maximal value (max), the range (range, that is, max-min) and the sum of all non-missing values (sum)
desc:do we have to return various descriptive statistics (by default, it is TRUE)? These are: the median (median), the mean (mean), the standard error on the mean (SE.mean), the confidence interval of the mean (CI.mean) at the p level, the variance (var), the standard deviation (std.dev) and the variation coefficient (coef.var) defined as the standard deviation divided by the mean
norm:do we have to return normal distribution statistics (by default, it is FALSE)? the skewness coefficient g1 (skewness), its significant criterium (skew.2SE, that is, g1/2.SEg1; if skew.2SE > 1, then skewness is significantly different than zero), kurtosis coefficient g2 (kurtosis), its significant criterium (kurt.2SE, same remark than for skew.2SE), the statistic of a Shapiro-Wilk test of normality (normtest.W) and its associated probability (normtest.p)