

1. Circos简介
Circos用于画基因组圈图。其帮助文档:http://www.circos.ca/documentation/tutorials/
2. Circos的安装
Circs是perl写出来的程序,其正常使用需要依赖于一些Perl模块,特别是GD。GD的安装如下:
先安装libgd:
# unzip libgd-gd-libgd-00cd9583242e.zip
# cd libgd-gd-libgd-00cd9583242e/
# ./bootstrap.sh
# ./configure && make -j 4 && make install
# gdlib-config
# cd ..
# rm -rf libgd-gd-libgd-00cd9583242e
再安装GD
# ln -s /usr/lib64/libgd.so.2.0.0 /usr/lib64/libgd.so.3
# cpan -i GD
下载circos并安装:
$ wget http://circos.ca/distribution/circos-tools-0.18.tgz
$ wget http://circos.ca/distribution/circos-0.66.tgz
$ wget http://circos.ca/distribution/circos-tutorials-0.66.tgz
$ wget http://circos.ca/distribution/circos-course-0.67.tgz
$ tar zxf circos-0.66.tgz
$ cd circos-0.66/bin
$ ./list.modules #该命令列出circos所需求的perl模块
$ ./test.modules #该命令检测这些所需求的perl模块是否正确安装上
$ sudo cpan -i Config::General Font::TTF List::MoreUtils Math::Bezier Math::Round Math::VecStat Params::Validate Readonly Regexp::Common Set::IntSpan Text::Format Clone
$ ./gddiag #检测GD是否能用于画图,最终能生成diag.png文件
$ ./circos --help #能给出简单的命令帮助文件,否则安装不成功
$ cd ../example/
$ ../bin/circos -conf etc/circos.conf #一个使用的例子
3. Circos的配置文件准备
Circos的使用主要通过输入一个配置文件。该配置文件的内容格式主要以各种区块表示,大区块中可以包含小区块。区块中以“变量 = 值”的方式来进行参数的设定。例如:
<links>
<link>
 file = data/set1.txt
 color = black
 ...
</link>
<link>
 file = data/set2.txt
 color = red
 ...
</link>
</links>
此外,有些配置信息一般不需要改动,比如颜色,字体等。我们一般将这类信息保存到一个独立的配置文件中。只需要在主配置文件中声明包含这些独立的配置文件名,即表示使用其配置信息。例如,最常用的放置到主配置文件尾部的数行:
设置生成的图片参数
<image>
<<include etc/image.conf>>
</image>
设置颜色,字体,填充模式的配置信息:
<<include etc/colors_fonts_patterns.conf>>
系统与debug参数:
<<include etc/housekeeping.conf>>
4. Circos的使用参数
-version
 查询circos版本
 -modules
 检测perl模块
 -conf <string>
 输入主配置文件
 -outputdir <string>
 设置输出文件的路径
 -outputfile <string>
 设置输出文件名,该参数的值以.png为后缀
 -svg
 生成svg结果文件
 -nosvg
 不生成svg结果文件
5. Circos配置文件详解
Circos的命令使用简单,但是配置文件极其复杂,以下从各个track进行详解
5.1 ideogram block 显示染色体
将染色体在圈图上展示出来,代表每个染色体的图形,称为ideogram。将以下配置信息放入一个单独的配置文件中,给其命名 ideogram.conf 。
<ideogram>
## 设定 ideograms 之间的空隙
 <spacing>
 # 设置圈图中染色体之间的空隙大小,以下设置为每个空隙大小为周长的 0.5%
 default = 0.005r
# 也可以设置指定两条染色体之间的空隙
 #<pairwise hsY;hs1>
 # 以下设定为两条染色体之间的空隙约为圆的 20 度角。
 #spacing = 20r
 #</pairwise>
</spacing>
## 设定 ideograms
 # 设定 ideograms 的位置,以下设定 ideograms 在图离圆心的 90% 处
 radius = 0.90r
 # 设定 ideograms 的厚度,可以使用 r(比例关系) 或 p(像素)作为单位
 thickness = 20p
 # 设定 ideograms 是否填充颜色。填充的颜色取决于 karyotype 指定的文件的最后一列。
 fill = yes
 # 设定 ideograms 轮廓的颜色及其厚度。如果没有该参数或设定其厚度为0,则表示没有轮廓。
 stroke_color = dgrey
 stroke_thickness = 2p
## 设定 label 的显示
 # 设定是否显示 label 。 label 对应着 karyotype 文件的第 4 列。如果其值为 yes,则必须要有 label_radius 参数来设定 label 的位置,否则会报错并不能生成结果。
 show_label = yes
 # 设定 label 的字体
 label_font = default
 # 设定 label 的位置
 label_radius = 1r+90p
 # 设定 label 的字体大小
 label_size = 40
 # 设定 label 的字体方向,yes 是易于浏览的方向。
 label_parallel = yes
</ideogram>
5.2 ticks block 以刻度形式显示染色体大小
将染色体的大小以刻度的形式在圈图上展示出来。将以下配置信息放入一个单独的配置文件中,给其命名 ticks.conf 。
# 是否显示 ticks
 show_ticks = yes
 # 是否显示 ticks 的 lables
 show_tick_labels = yes
## 设定 ticks
 <ticks>
 ## ticks 的设置
 # 设定 ticks 的位置
 radius = 1r
 # 设定 ticks 的颜色
 color = black
 # 设定 ticks 的厚度
 thickness = 2p
 # 设定 ticks' label 的值的计算。将该刻度对应位置的值 * multiplier 得到能展示到圈图上的 label 值。
 multiplier = 1e-6
 # label 值的格式化方法。%d 表示结果为整数;%f 结果为浮点数; %.1f 结果为小数点后保留1位; %.2f 结果为小数点后保留2位。
 format = %d
## 以下设置了 2 个 ticks,前者是小刻度,后者是大刻度。
 <tick>
 # 设置每个刻度代表的长度。若其单位为 u,则必须要设置 chromosomes_units 参数。比如设置 chromosomes_units = 1000000,则如下 5u 表示每个刻度代表 5M 长度的基因组序列。
 spacing = 5u
 # 设置 tick 的长度
 size = 10p
 </tick>
<tick>
 spacing = 25u
 size = 15p
 # 由于设置的是大刻度,以下用于设置展示 ticks' label。
 show_label = yes
 # 设置 ticks' label 的字体大小
 label_size = 20p
 # 设置 ticks' label 离 ticks 的距离
 label_offset = 10p
 format = %d
 </tick>
</ticks>
5.3 links block 以曲线连接显示基因组内部区域之间的联系
基因组内部不同的序列区域之间有联系,将之使用线条进行连接,从而展示到圈图上。常见的是重复序列之间的连接。将以下配置信息放入一个单独的配置文件中,给其命名 links.conf 。
<links>
<link>
 # 指定 link 文件的路径,其文件格式为:
 # chr1 start end chr2 start end
 # hs1 465 30596 hs2 114046768 114076456
 # 表明这两个染色体区域有联系,例如这个区域的序列长度>1kb且序列相似性>=90%。
 file = data/5/segdup.txt
 # 设置 link 曲线的半径
 radius = 0.8r
 # 设置贝塞尔曲线半径,该值设大后曲线扁平,使图像不太好看。
 bezier_radius = 0r
 # 设置 link 曲线的颜色
 color = black_a4
 # 设置 link 曲线的厚度
 thickness = 2
<rules>
 # 以下可以设置多个 rules,用来对 link 文件的每一行进行过滤或展示进行设定。每个 rule 都有一个 condition 参数;如果该 condition 为真,除非 flow=continue ,则不
# 如果 link 文件中该行数据是染色体内部的 link,则不对其进行展示
 <rule>
 condition = var(intrachr)
 show = no
 </rule>
# 设置 link 曲线的颜色与 ideogram 的颜色一致,否则为统一的颜色。
 <rule>
 # condition 为真,则执行该 block 的内容
 condition = 1
 # 设置 link 曲线的颜色为第 2 条染色体的颜色。对应这 link 文件中第 4 列数据对应的染色体的名称
 color = eval(var(chr2))
 # 虽然 condition 为真,但依然检测下一个 rule
 flow = continue
 </rule>
# 如果 link 起始于 hs1,则其 link 曲线半径为 0.99r
 <rule>
 condition = from(hs1)
 radius1 = 0.99r
 </rule>
# 如果 link 结束于 hs1,则其 link 曲线半径为 0.99r
 <rule>
 condition = to(hs1)
 radius2 = 0.99r
 </rule>
</rules>
</link>
</links>
5.4 plots block 以直方图形式展示数据
将基因组序列的GC含量,表达量等以直方图的形式在圈图中展示出来。将以下配置信息放入一个单独的配置文件中,给其命名 plots_histogram.conf 。以下作了两个直方图,并对分别添上背景或网格线。
<plot>
 # 设定为直方图
 type = histogram
 # 数据文件路径,为 4 列:
 # chromosome start end data
 # hs1 0 1999999 180.0000
 file = data/5/segdup.hs1234.hist.txt
 # 设置直方图的位置,r1 要比 r0 大。直方图的方向默认为向外。
 r1 = 0.88r
 r0 = 0.81r
 # 直方图的填充颜色
 fill_color = vdgrey
 # 默认下直方图轮廓厚度为 1px,若不需要轮廓,则设置其厚度为0,或在 etc/tracks/histogram.conf 中修改。
 thickness = 0p
 # 直方图是由 bins (条行框)所构成的。若 bins 在坐标上不相连,最好设置不要将其bins连接到一起。例如:
 # hs1 10 20 0.5
 # hs1 30 40 0.25
 # 上述数据设置值为 yes 和 no 时,图形是不一样的。
 extend_bin = no
# 以下添加 rule ,不在 hs1 上添加直方图。
 <rules>
 <<include exclude.hs1.rule>>
 </rules>
# 设定直方图的背景颜色
 <backgrounds>
 show = data
<background>
 color = vvlgrey
 </background>
 <background>
 color = vlgrey
 y0 = 0.2r
 y1 = 0.5r
 </background>
 <background>
 color = lgrey
 y0 = 0.5r
 y1 = 0.8r
 </background>
 <background>
 color = grey
 y0 = 0.8r
 </background>
</backgrounds>
</plot>
<plot>
 type = histogram
 # 此处直方图的数据文件第 4 列是多个由逗号分割的数值,需要制作叠加的直方图。
 file = data/5/segdup.hs1234.stacked.txt
 r1 = 0.99r
 r0 = 0.92r
 # 给 4 个值按顺序填充不同的颜色
 fill_color = hs1,hs2,hs3,hs4
 thickness = 0p
 orientation = in
 extend_bin = no
<rules>
 <<include exclude.hs1.rule>>
 </rules>
# 在直方图中添加坐标网格线
 <axes>
 show = data
 thickness = 1
 color = lgrey
<axis>
 spacing = 0.1r
 </axis>
 <axis>
 spacing = 0.2r
 color = grey
 </axis>
 <axis>
 position = 0.5r
 color = red
 </axis>
 <axis>
 position = 0.85r
 color = green
 thickness = 2
 </axis>
</axes>
</plot>
5.5 plots block 以热图形式显示数据
基因组一个区域内有多组数据时,适合以热图形式显示数据。比如基因表达量。将以下配置信息放入一个单独的配置文件中,给其命名 plots_heatmap.conf 。
<plot>
 # 绘制 heat map
 type = heatmap
 # 设定数据文件路径。文件有 5 列
 # chrID start end data class
 # hs1 0 1999999 113.0000 id=hs1
 # hs1 0 1999999 40.0000 id=hs4
 # hs1 0 1999999 20.0000 id=hs2
 # hs1 0 1999999 7.0000 id=hs3
 file = data/5/segdup.hs1234.heatmap.txt
 # 设定图形所处位置
 r1 = 0.89r
 r0 = 0.88r
 # 设定热图的颜色。颜色为 hs3 ,以及相应带不同透明程度的 5 种颜色。
 color = hs1_a5,hs1_a4,hs1_a3,hs1_a2,hs1_a1,hs1
 # 设定 scale_log_base 参数。计算颜色的方法如下:
 # f = (value - min) / ( max - min ) 热图中每个方块代表着一个值,并给予相应的颜色标示。一系列的值 [min,max] 对应一系列的颜色 c[n], i=0..N
 # n = N * f ** (1/scale_log_base)
 # 由上面两个公式计算出代表颜色的 n 值。
 # 若 scale_log_base = 1,则数值与颜色的变化是线性的;
 # 若 scale_log_base > 1,则颜色向小方向靠近;
 # 若 scale_log_base < 1,则颜色向大方向靠近。
 scale_log_base = 5
<rules>
 <<include exclude.hs1.rule>>
# 仅显示 id = hs1 的数据
 <rule>
 condition = var(id) ne "hs1"
 show = no
 </rule>
</rules>
</plot>
<plot>
 type = heatmap
 file = data/5/segdup.hs1234.heatmap.txt
 r1 = 0.90r
 r0 = 0.89r
 color = hs2_a5,hs2_a4,hs2_a3,hs2_a2,hs2_a1,hs2
 scale_log_base = 5
<rules>
 <<include exclude.hs1.rule>>
<rule>
 condition = var(id) ne "hs2"
 show = no
 </rule>
</rules>
</plot>
<plot>
 type = heatmap
 file = data/5/segdup.hs1234.heatmap.txt
 r1 = 0.91r
 r0 = 0.90r
 color = hs3_a5,hs3_a4,hs3_a3,hs3_a2,hs3_a1,hs3
 scale_log_base = 5
<rules>
 <<include exclude.hs1.rule>>
<rule>
 condition = var(id) ne "hs3"
 show = no
 </rule>
</rules>
</plot>
<plot>
 type = heatmap
 file = data/5/segdup.hs1234.heatmap.txt
 r1 = 0.92r
 r0 = 0.91r
 color = hs4_a5,hs4_a4,hs4_a3,hs4_a2,hs4_a1,hs4
 scale_log_base = 5
<rules>
 <<include exclude.hs1.rule>>
<rule>
 condition = var(id) ne "hs4"
 show = no
 </rule>
</rules>
</plot>
5.6 plots block 以文本形式显示数据
若需要在圈图上显示一些基因的名称,此时需要以文本形式显示数据。将以下配置信息放入一个单独的配置文件中,给其命名 plots_text.conf 。
<plot>
 # 表示出文字
 type = text
 # 数据文件路径
 file = data/6/genes.labels.txt
 # 显示在图形中的位置
 r1 = 0.8r
 r0 = 0.6r
 # 标签的字体
 label_font = light
 # 标签大小
 label_size = 12p
 # 文字边缘的大小,设置较小则不同单词就可能会连接到一起了。
 # padding - text margin in angular direction
 # rpadding - text margin in radial direction
 rpadding = 5p
 # 设置是否需要在 label 前加一条线,用来指出 lable 的位置。
 show_links = no
 link_dims = 0p,2p,5p,2p,2p
 link_thickness = 2p
 link_color = black
<rules>
 <<include exclude.hs1.rule>>
# 设置 rule ,对 label 中含有字母 a 或 b 的特异性显示
 <rule>
 condition = var(value) =~ /a/i
 label_font = bold
 flow = continue
 </rule>
 <rule>
 condition = var(value) =~ /b/i
 color = blue
 </rule>
 </rules>
</plot>
5.7 rules block 放置常用的规则配置
本例子中,很多track没有在1号染色体上展示,需要设置如下规则信息,将之写入到文件 exclude.hs1.rule 中
<rule>
 condition = on(hs1)
 show = no
 </rule>
5.8 主配置文件
在主配置文件 circos.conf 中,包含以上所需要的配置文件信息,则可以画出所需要的track。此外,可以设置一些全局的设置。
# 指定染色体组型的文件,该文件有 7 列,例如:
 # chr - ID LABEL START END COLOR
 # chr - hs1 1 0 249250621 chr1
 # chr - hs2 2 0 243199373 chr2
 karyotype = data/karyotype/karyotype.human.txt
# 设置长度单位,以下设置表示 1M 长度的序列代表为 1u。
 chromosomes_units = 1000000
# 默认设置下是将 karyotype 文件中所有的染色体都展示出来。当然,也可能根据需要仅展示指定的 chromosomes, 使用如下的参数进行设置。
 chromosomes_display_default = no
 # 以下参数设置指定的 chromosomes 用于展示到圈图中。// 中是一个正则表达式,匹配的 chromosomes 用于展示到圈图中。其匹配的对象是 karyotype 文件中的第 3 列。也可以直接列出需要展示的 chromosomes, 例如:hs1;hs2;hs3;hs4 。
 chromosomes = /hs[1-4]$/
 # chromosomes = hs1;hs2;hs3;hs4
# 以下设置各个 ideograms 的大小。其总长度为 1 ,hs1 的长度为 0.5, hs2,hs3 和 hs4 这 3 个 chromosomes 的总长度为 0.5,并且这 3 个 chromosomes 的长度是分布均匀的。注意前者的单位是 r, 后者使用了正则表达式对应多个 chromosomes, 其单位于是为 rn 。
 chromosomes_scale = hs1=0.5r,/hs[234]/=0.5rn
# 使 hs2, hs3 和 hs4 在圈图上的展示方向是反向的。
 chromosomes_reverse = /hs[234]/
# 设置各个 ideograms 的颜色
 chromosomes_color = hs1=red,hs2=orange,hs3=green,hs4=blue
# 默认下在 ideogram block 中统一设置了 ideogram 的位置,可以使用此参数调整指定 ideogram 的位置。
 chromosomes_radius = hs4:0.9r
 # chromosomes_radius = hs2:0.9r;hs3:0.8r;hs4:0.7r
# karyotype 文件最后一列指定了各个 chromosomes 的颜色,而使用 chromosomes_color 参数也能修改颜色。当然,使用如下方式进行颜色的修改,则更加直观。以下方式是对颜色重新进行定义。chr1,chr2,chr3 和 chr4 对应着 karyotype 文件最后一列的值,代表着颜色的类型。此处使用 color block 来对其进行重新定义。注意重新定义的时候需要加符号 *
 <colors>
 chr1* = red
 chr2* = orange
 chr3* = green
 chr4* = blue
 </colors>
### 绘制 plot 图
 <plots>
<<include plots_histogram.conf>>
 <<include plots_heatmap.conf>>
 <<include plots_text.conf>>
</plots>
<<include ideogram.conf>>
 <<include ticks.conf>>
 <<include links.conf>>
################################################################
 # 插入必须的并不常修改的标准参数
 <image>
 <<include etc/image.conf>>
 </image>
 <<include etc/colors_fonts_patterns.conf>>
 <<include etc/housekeeping.conf>>
5.9 使用 circos 命令画图
对配置文件设置完毕后,使用命令进行画图,先安装完毕 circos
$ cd circos-0.66
 $ tar zxf circos-tutorials-0.66.tgz
 $ mv data data.bak
 $ mv circos-tutorials-0.66/data/ ./
以上准备数据文件
然后将以上所有的配置文件在当前目录准备好,然后再运行程序进行画图
$ ./bin/circos -conf circos.conf
结果如下:
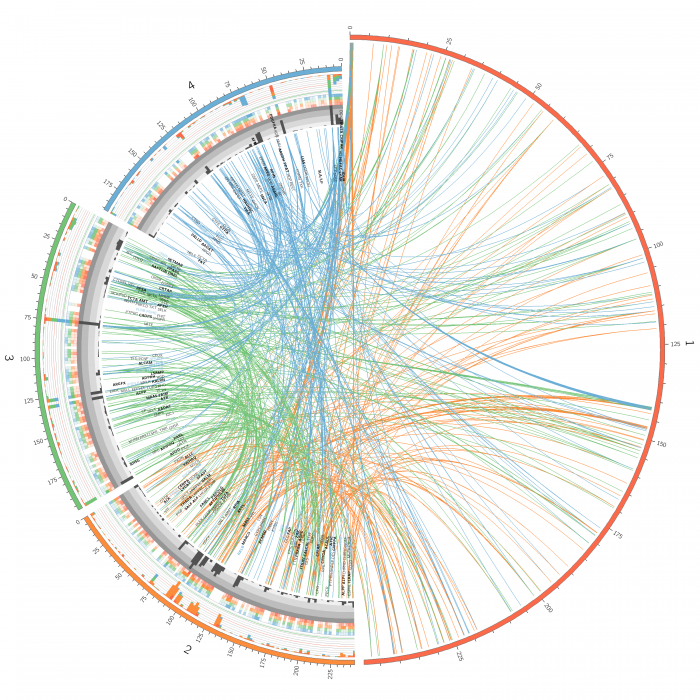
本文转载自http://www.chenlianfu.com/?p=2297