加载所需R包
library(ComplexHeatmap)
require(circlize)
setwd("/Users/Davey/Desktop/")
rm(list=ls())
构建测试数据集
mat = matrix(rnorm(80, 2), 8, 10)
mat = rbind(mat, matrix(rnorm(40, -2), 4, 10))
rownames(mat) = letters[1:12]
colnames(mat) = LETTERS[1:10]
head(mat)
##           A        B         C          D         E         F        G
## a 2.8012969 2.448959 1.9428114  1.5604724 1.9177726 0.2158233 3.317781
## b 0.9418123 2.209306 2.7862192  1.4398838 3.6213657 4.2668243 2.577691
## c 1.0953206 2.341528 1.7046930  2.2206123 0.5952640 1.8767222 2.788628
## d 3.3537403 2.854183 1.2874279 -0.8889426 0.3848691 1.9383945 1.960331
## e 2.6451243 1.665598 2.1922587  1.7396285 2.9845466 2.4252669 4.630288
## f 1.3739374 2.331968 0.8226535  2.6943106 2.3148574 0.8938749 2.646258
##           H         I         J
## a 0.2706951 1.5700012 1.8710984
## b 1.7695180 2.6903054 1.3462785
## c 1.9808171 0.8263468 1.7852170
## d 1.6676294 1.7265879 1.4762889
## e 0.6262087 2.4486098 0.7309366
## f 1.3369390 0.2074835 1.5872041
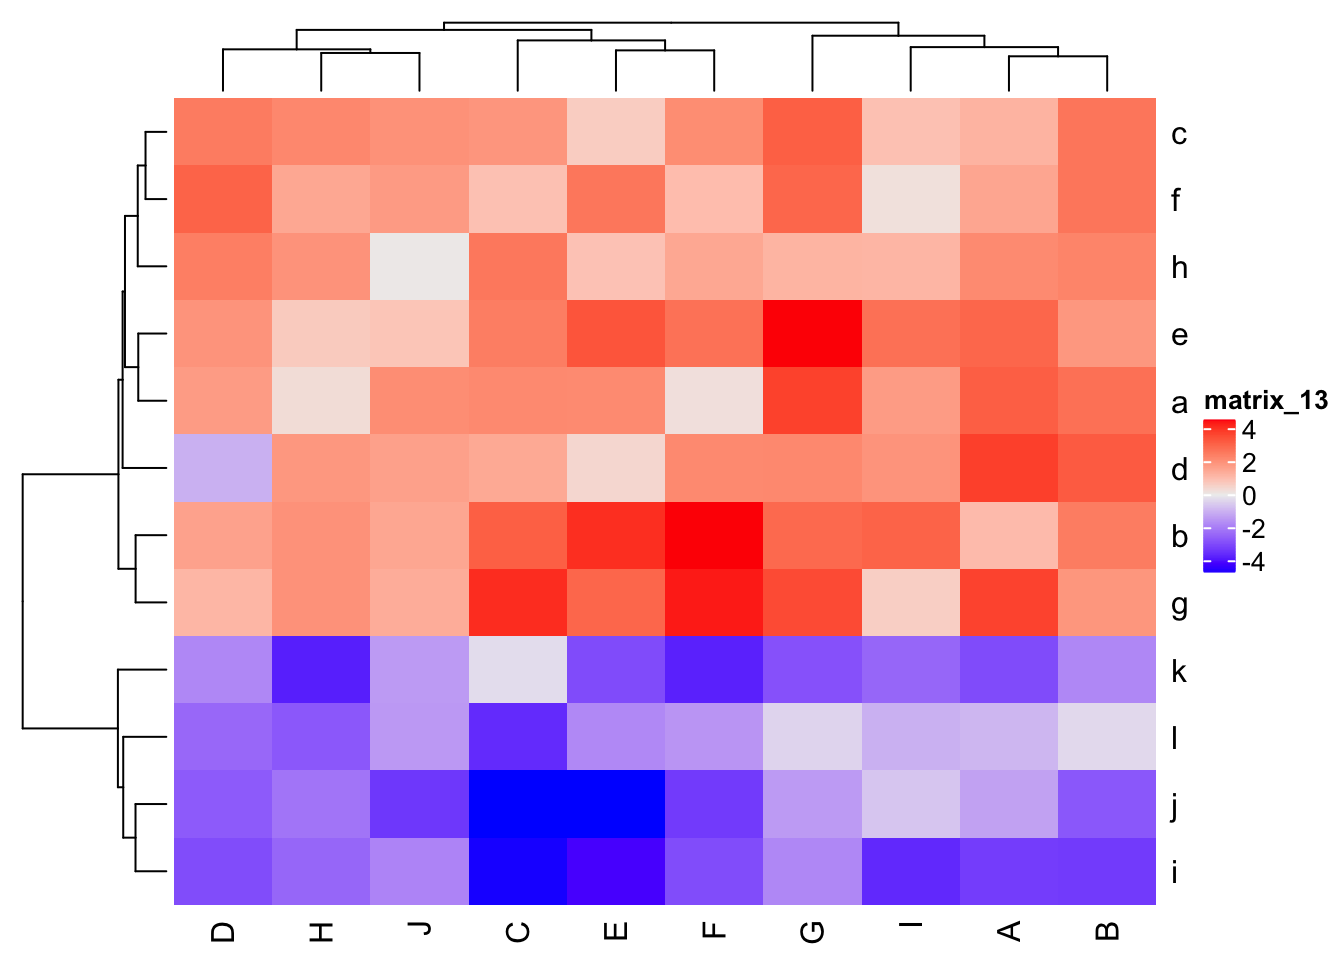
使用Heatmap函数绘制热图
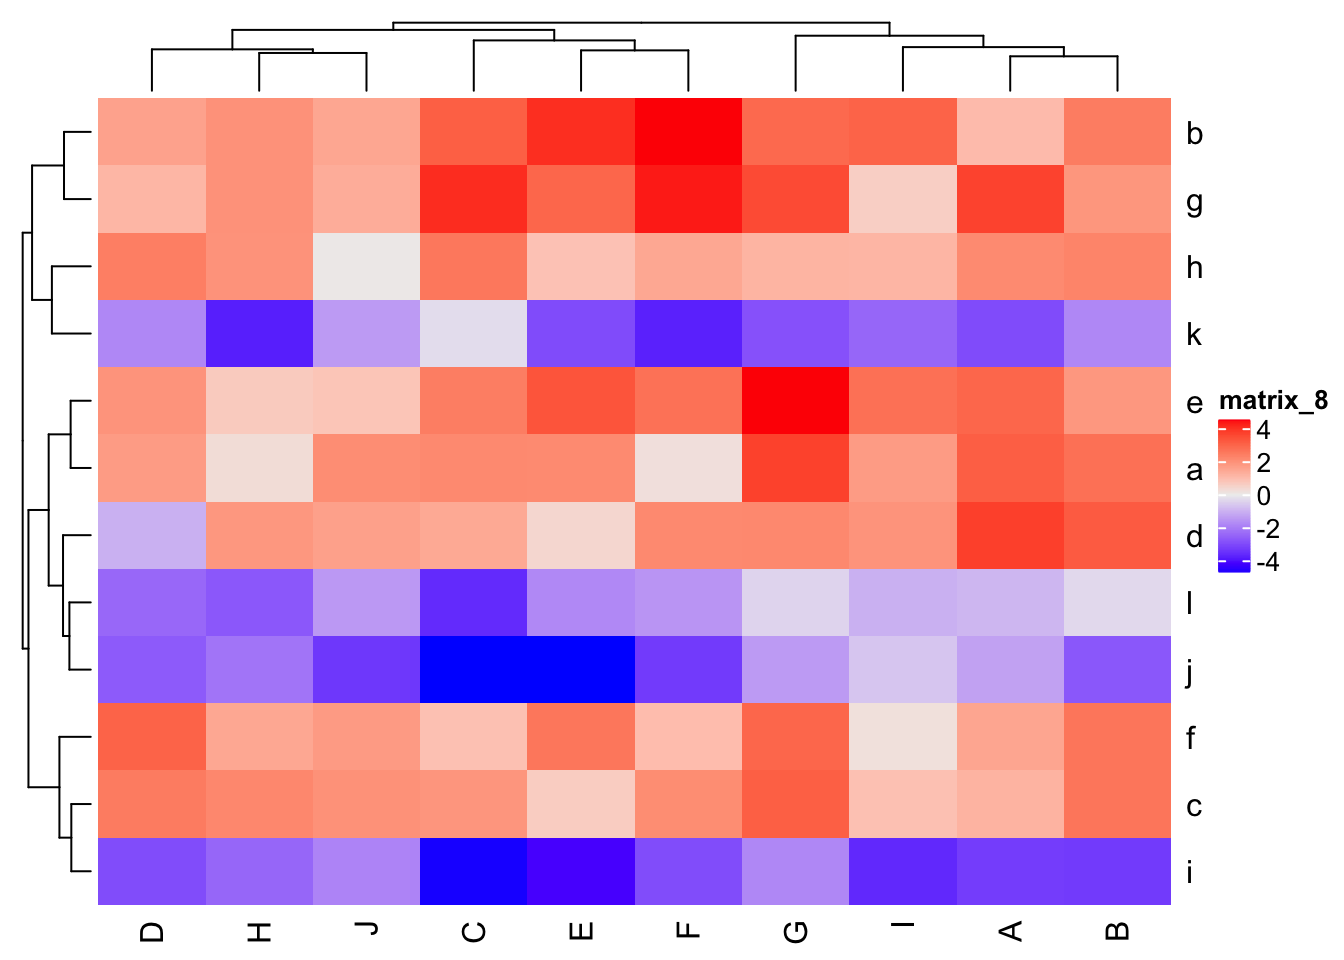
Heatmap(mat) #默认对行和列都进行聚类
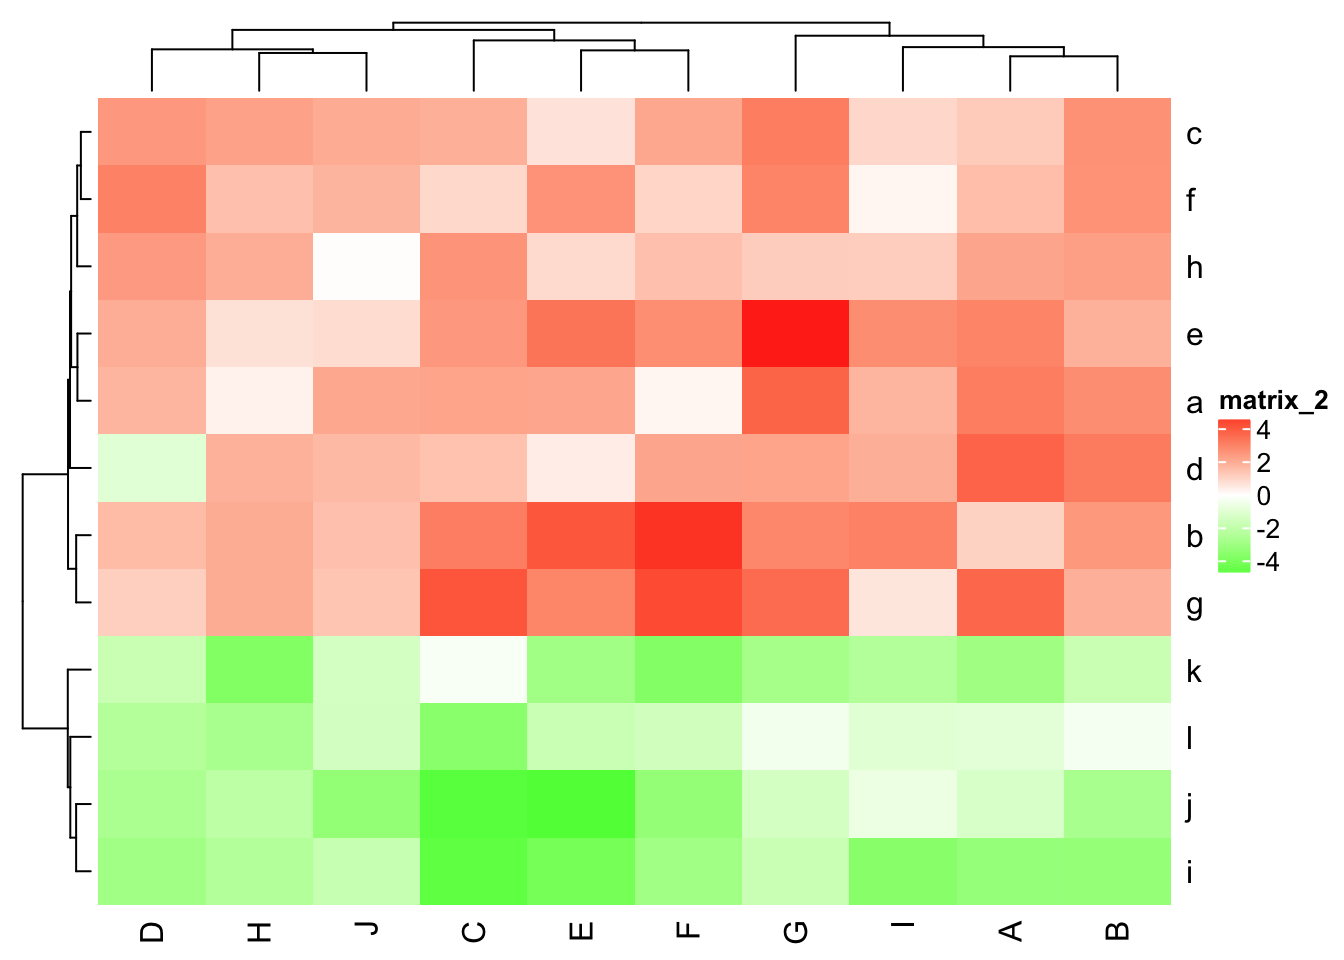
# col参数自定义颜色,colorRamp2函数来自于circlize包
Heatmap(mat, col = colorRamp2(c(-5, 0, 5), c("green", "white", "red")))
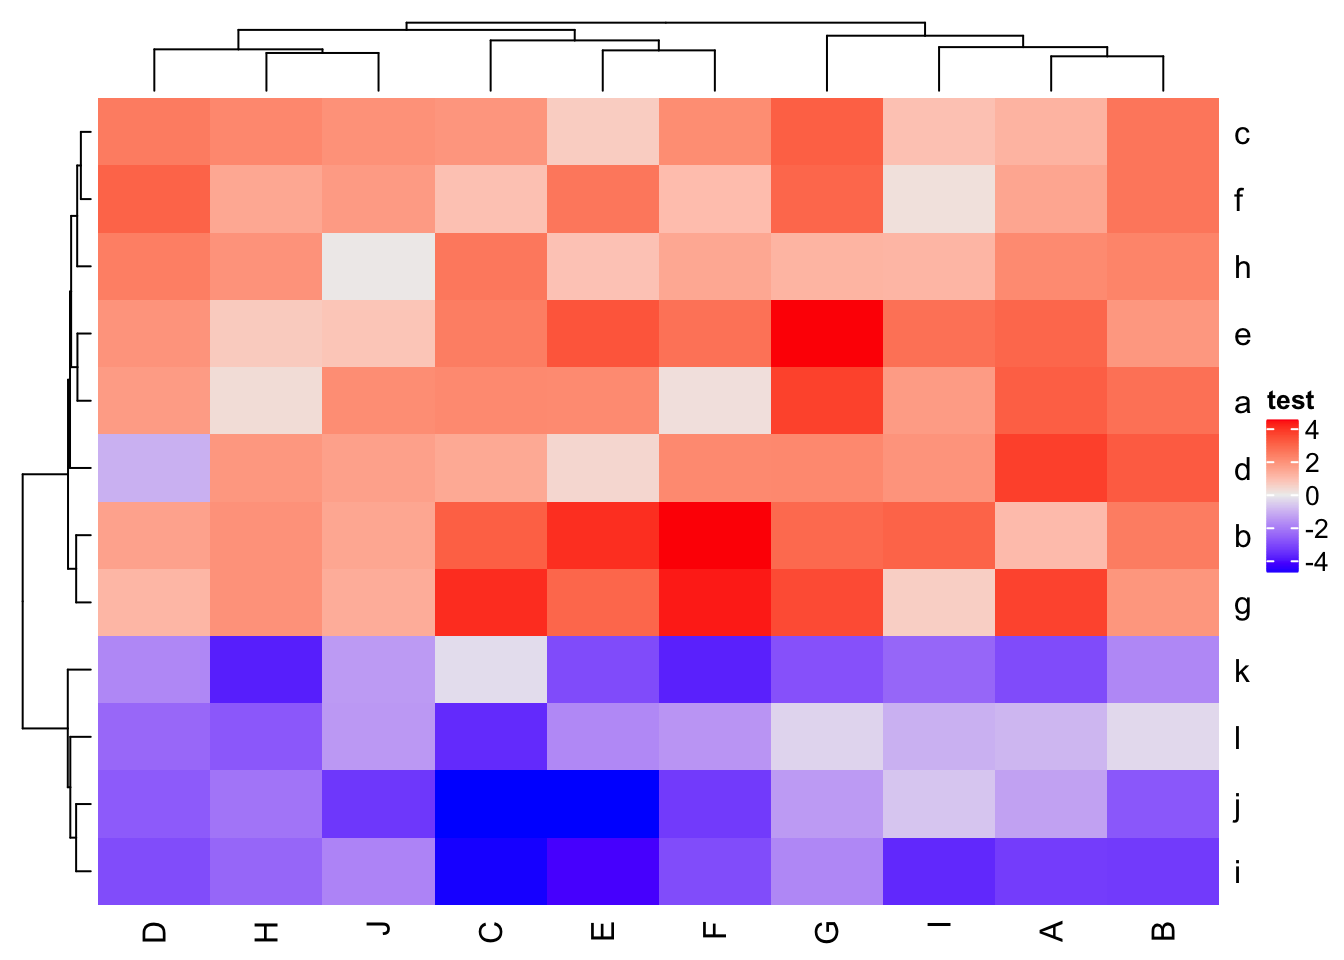
# name参数设定图例标题
Heatmap(mat, name = "test")
Heatmap(mat, heatmap_legend_param = list(
title= "legend", title_position = "topcenter",
legend_height=unit(8,"cm"), legend_direction="vertical"))
# row_title和column_title参数设定行和列的标题
Heatmap(mat, row_title = "blablabla", column_title = "blablabla")
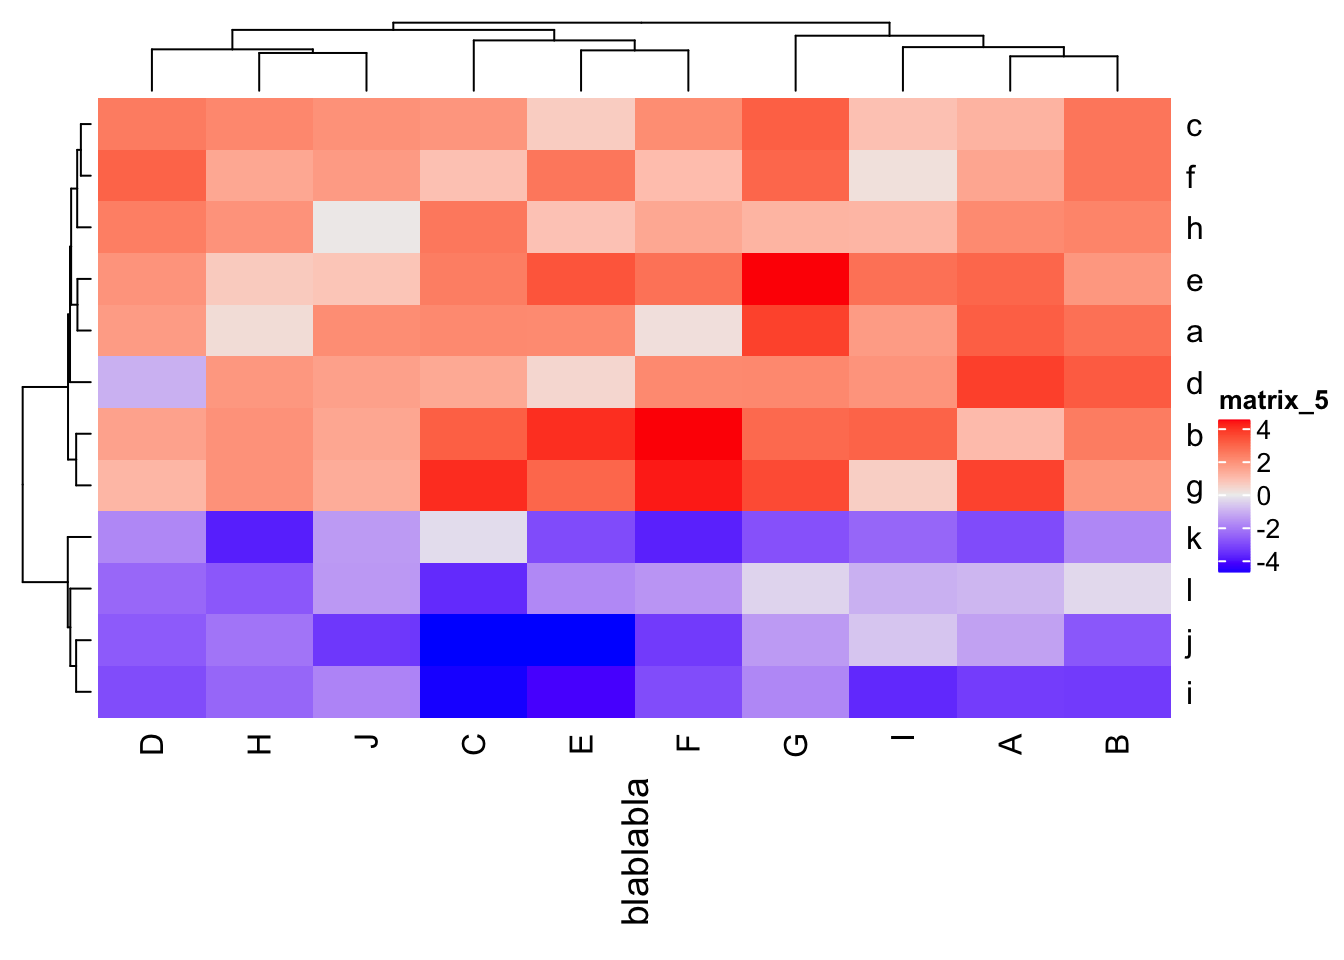
# column_title_side参数设定列标题放置的位置,column_title_rot参数设定列标题文本旋转的角度
Heatmap(mat, column_title = "blablabla", column_title_side = "bottom", column_title_rot = 90)
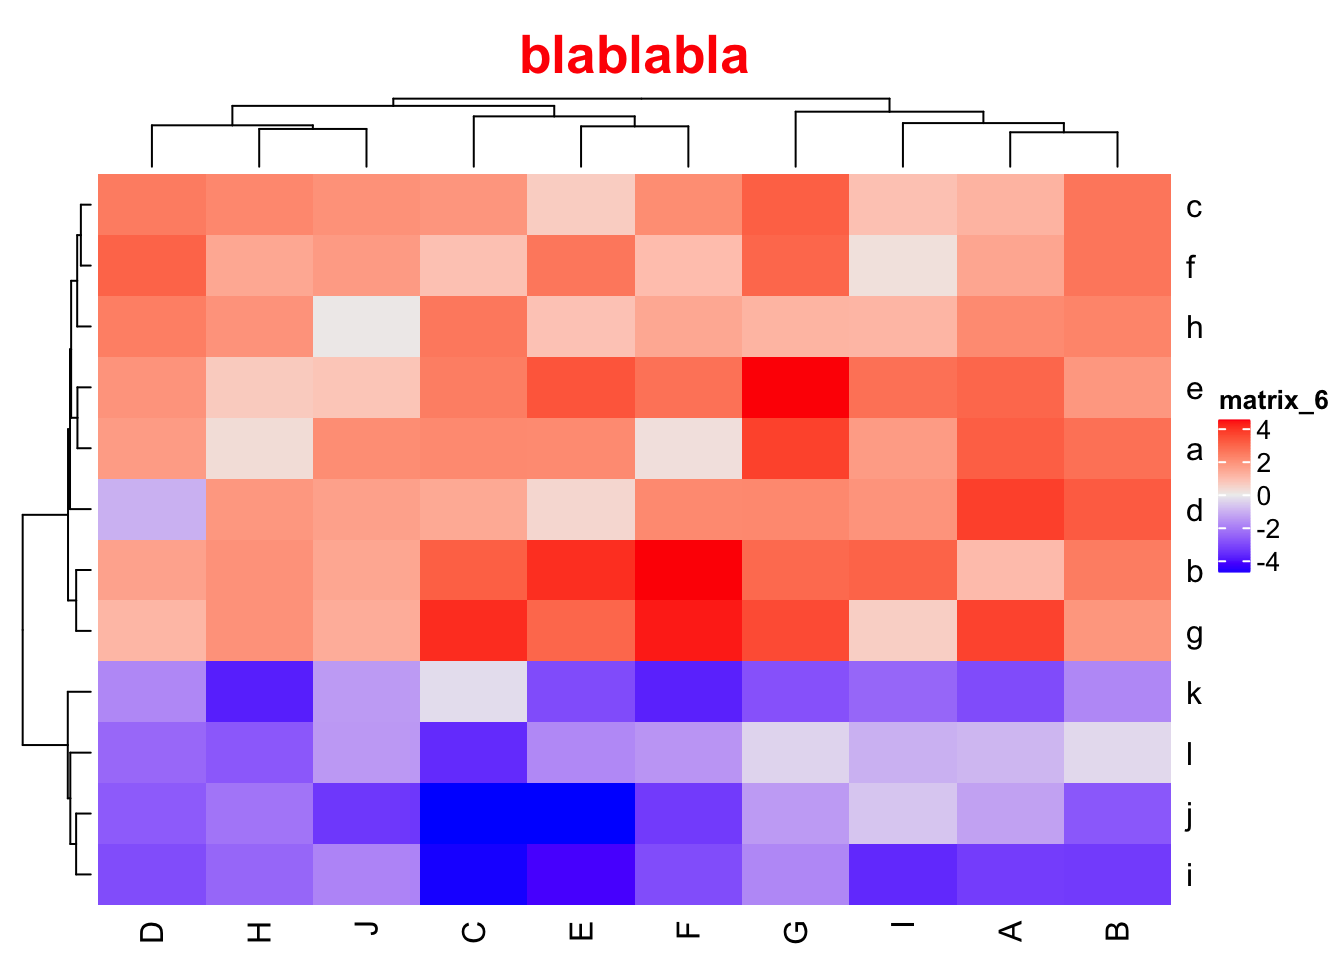
# column_title_gp参数设定列标题文本的格式(字体,大小,颜色等)
Heatmap(mat, column_title = "blablabla", column_title_gp = gpar(fontsize = 20, fontface = "bold", col="red"))
# cluster_rows和cluster_columns参数设定行或列是否聚类
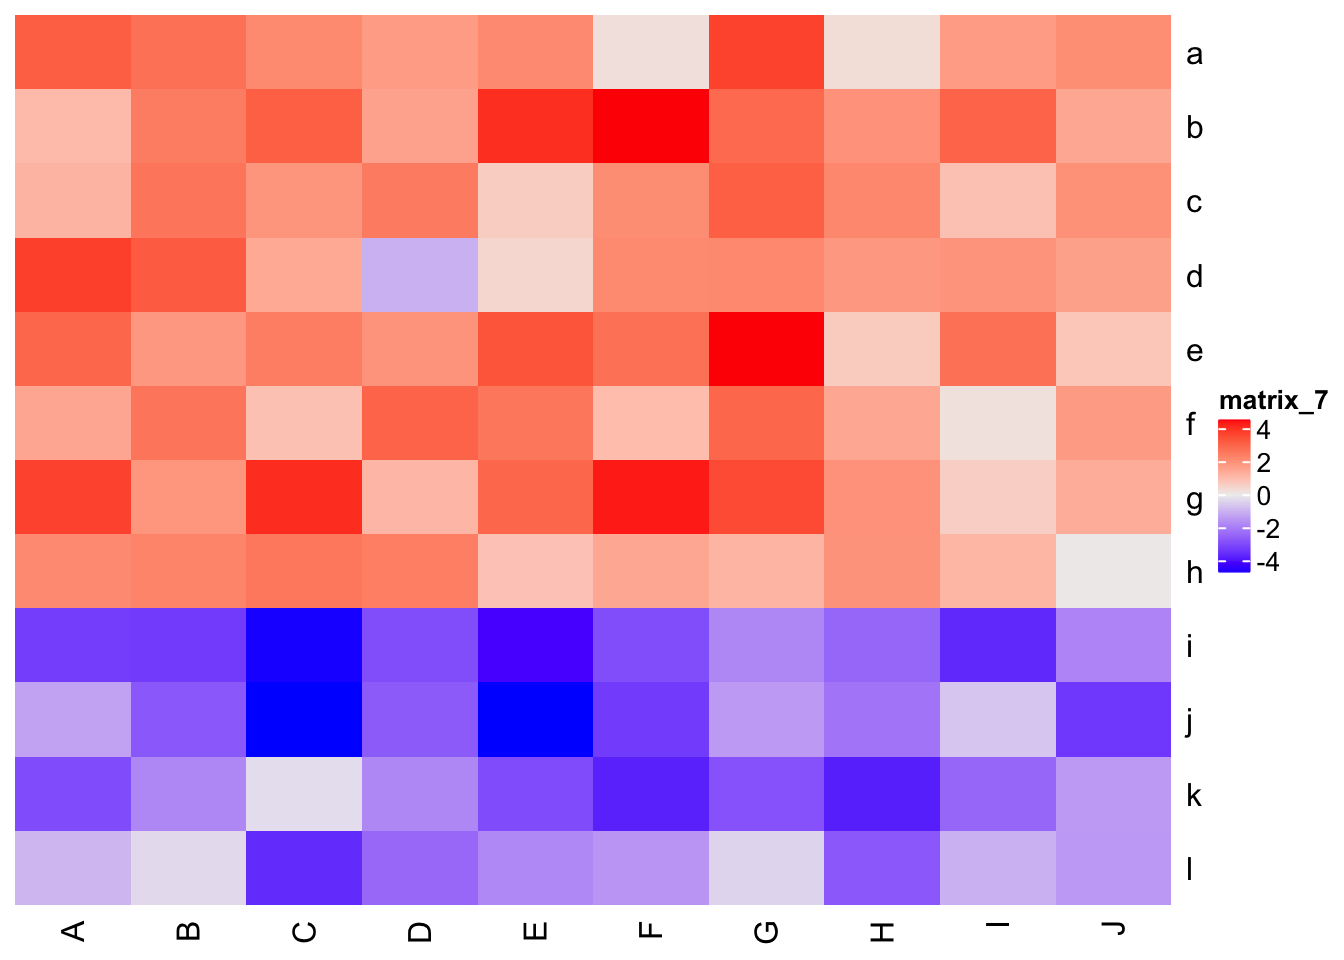
Heatmap(mat, cluster_rows = FALSE, cluster_columns = FALSE)
# clustering_distance_rows参数设定行聚类的距离方法,默认为"euclidean"
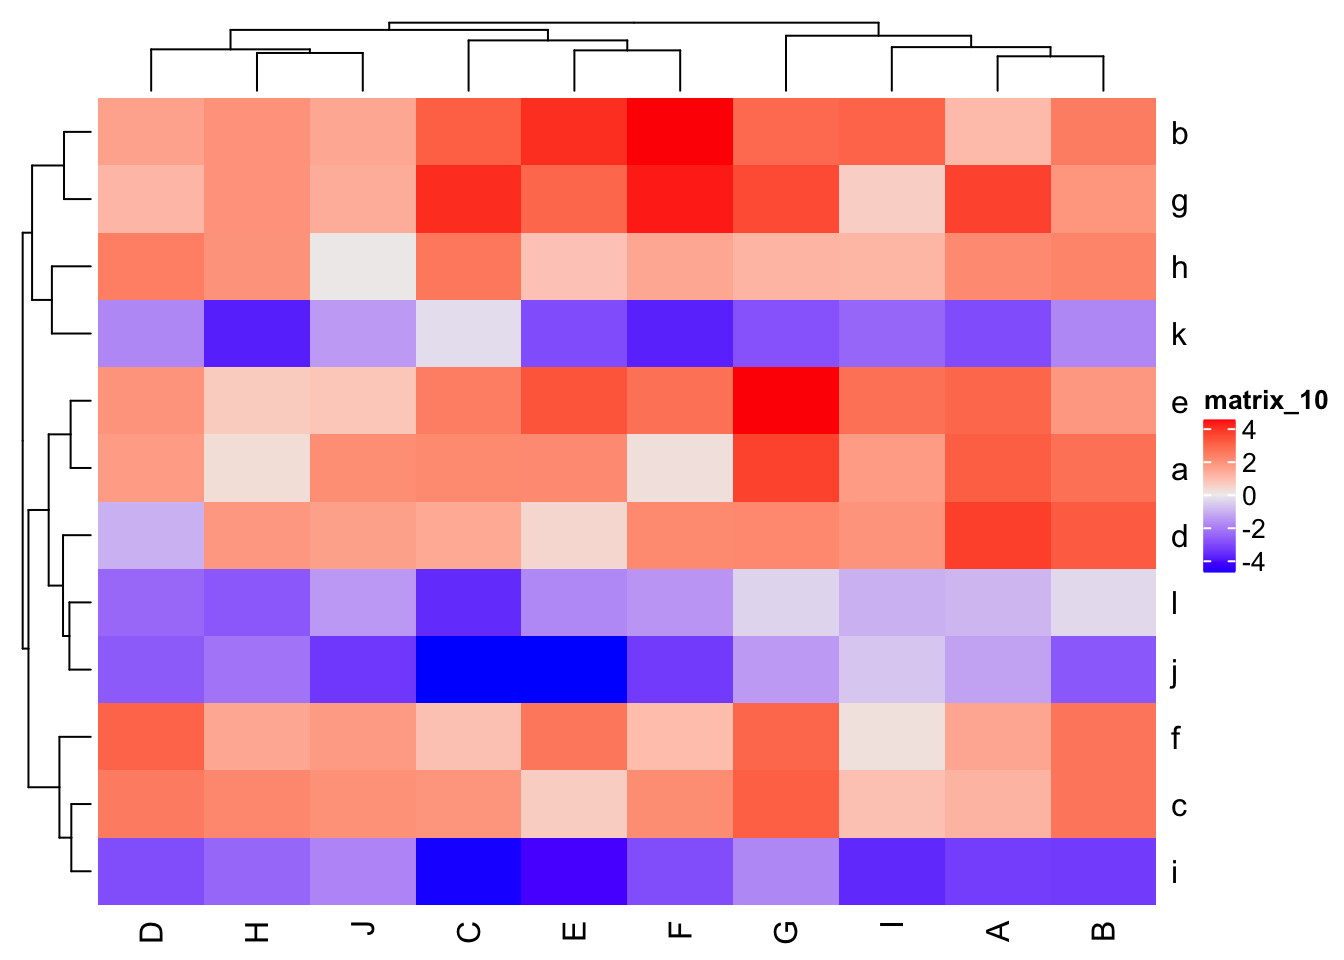
Heatmap(mat, clustering_distance_rows = "pearson")
Heatmap(mat, clustering_distance_rows = function(x) dist(x))
Heatmap(mat, clustering_distance_rows = function(x, y) 1 - cor(x, y))
# clustering_method_rows参数设定行聚类的方法,默认为"complete"
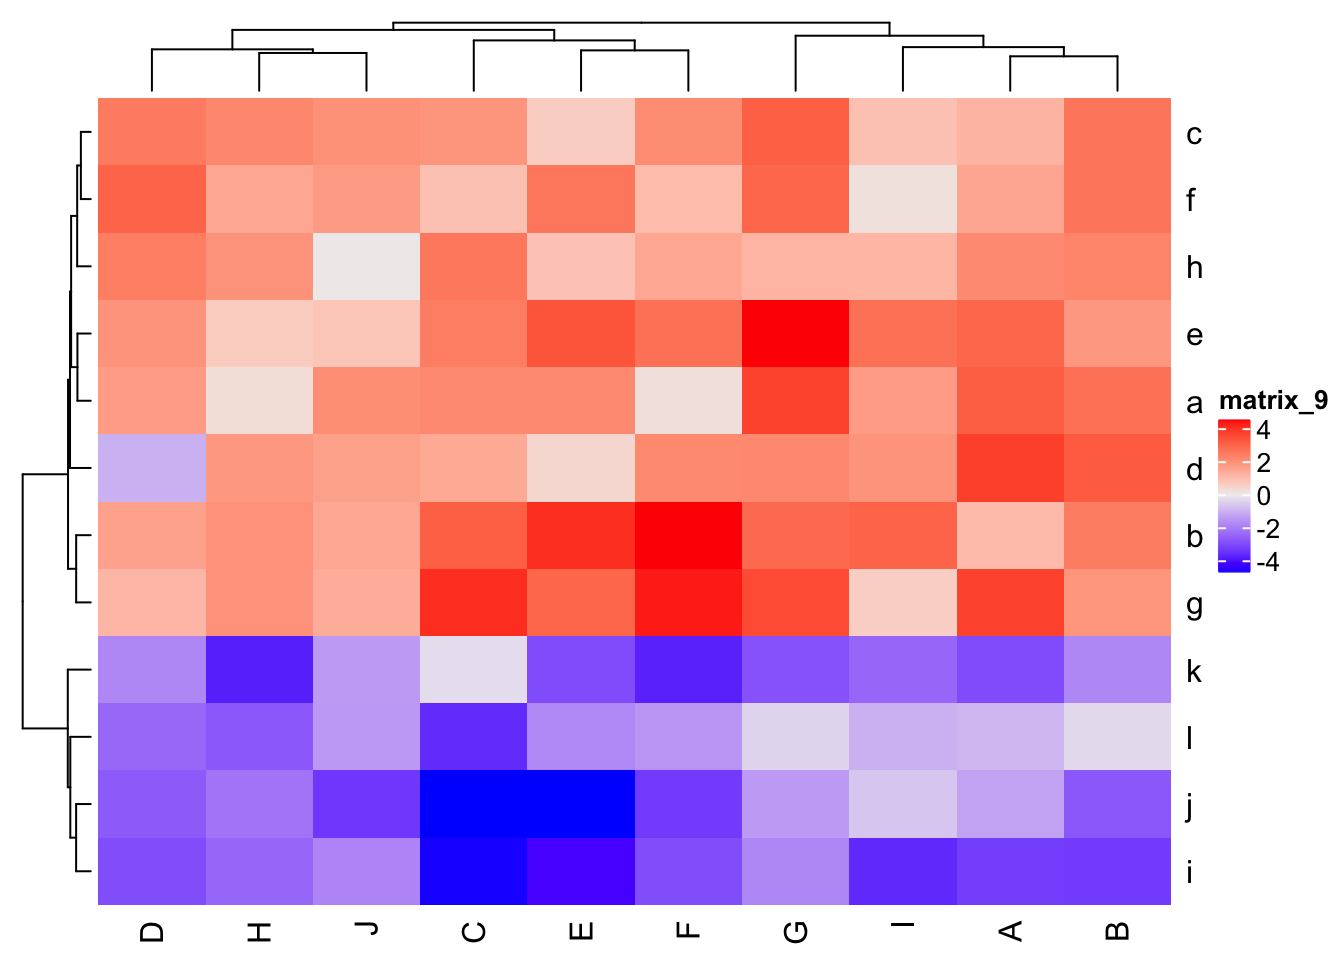
Heatmap(mat, clustering_method_rows = "single")
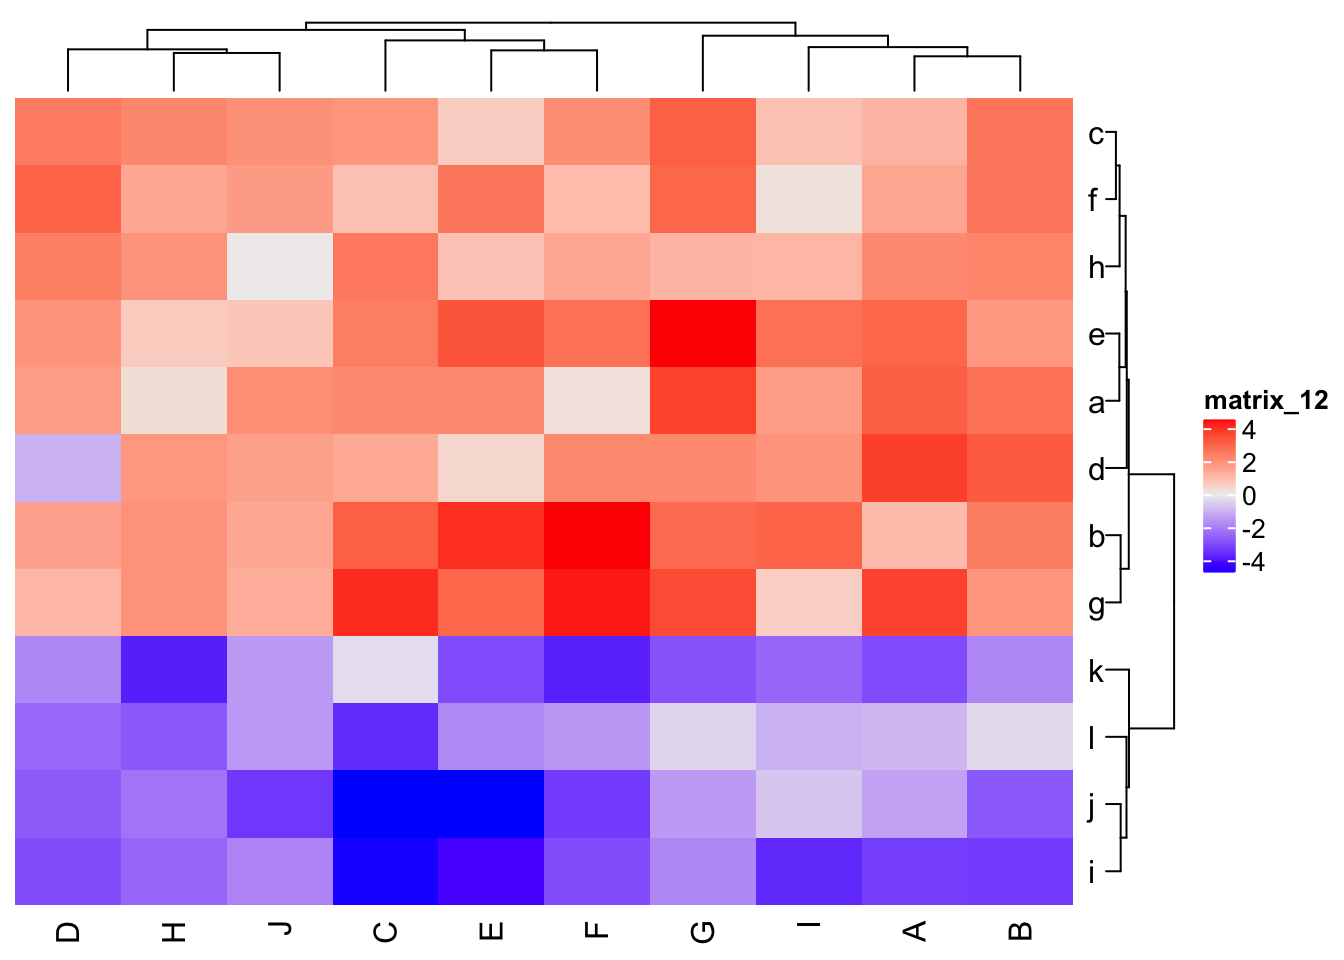
# row_dend_side参数设定行聚类树放置的位置
Heatmap(mat, row_dend_side = "right")
# row_dend_width参数设定行聚类树的宽度
Heatmap(mat, row_dend_width = unit(2, "cm"))
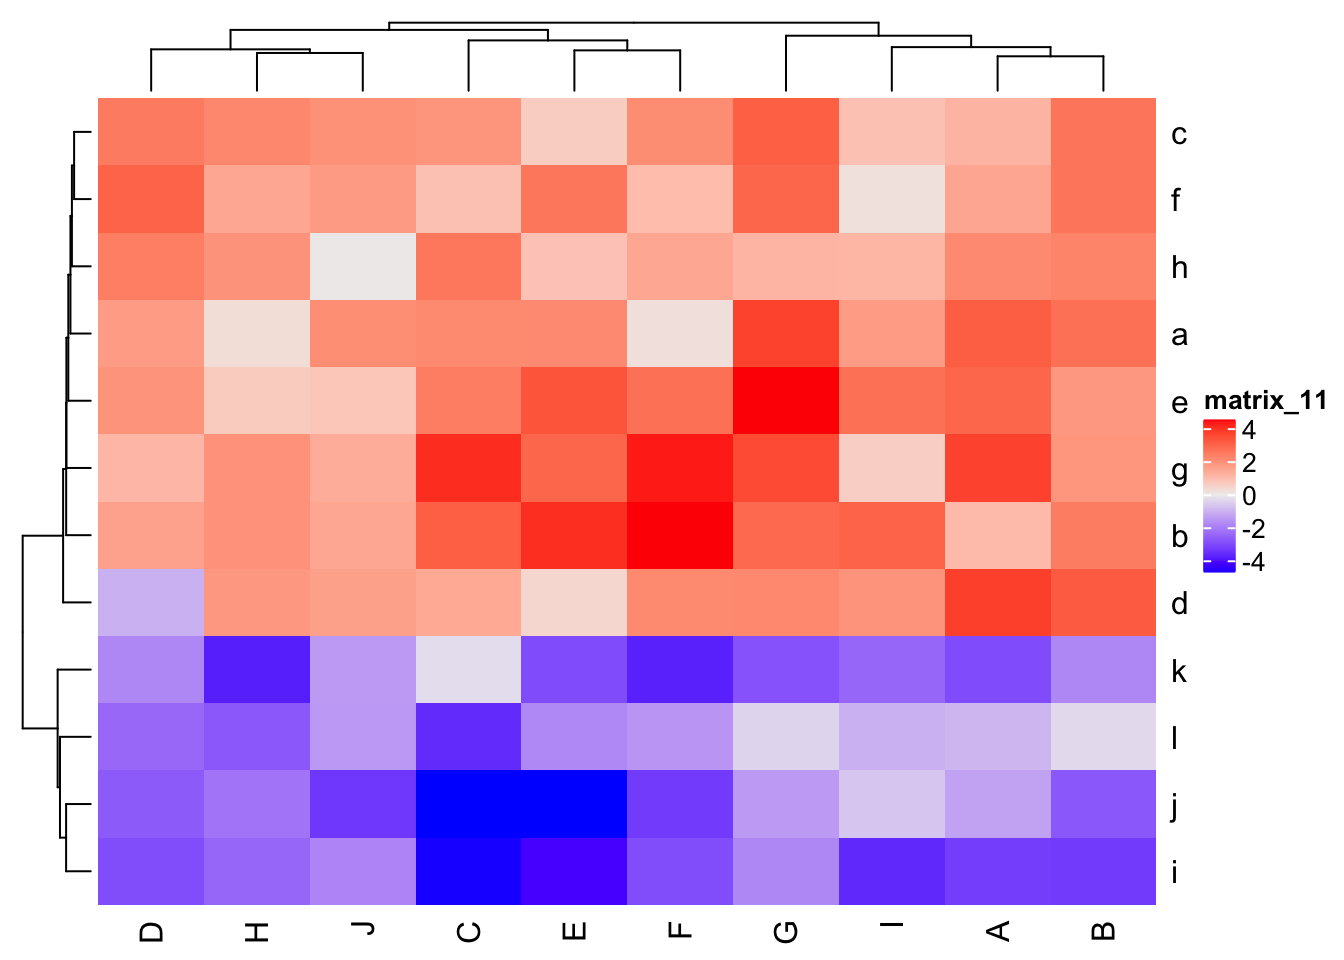
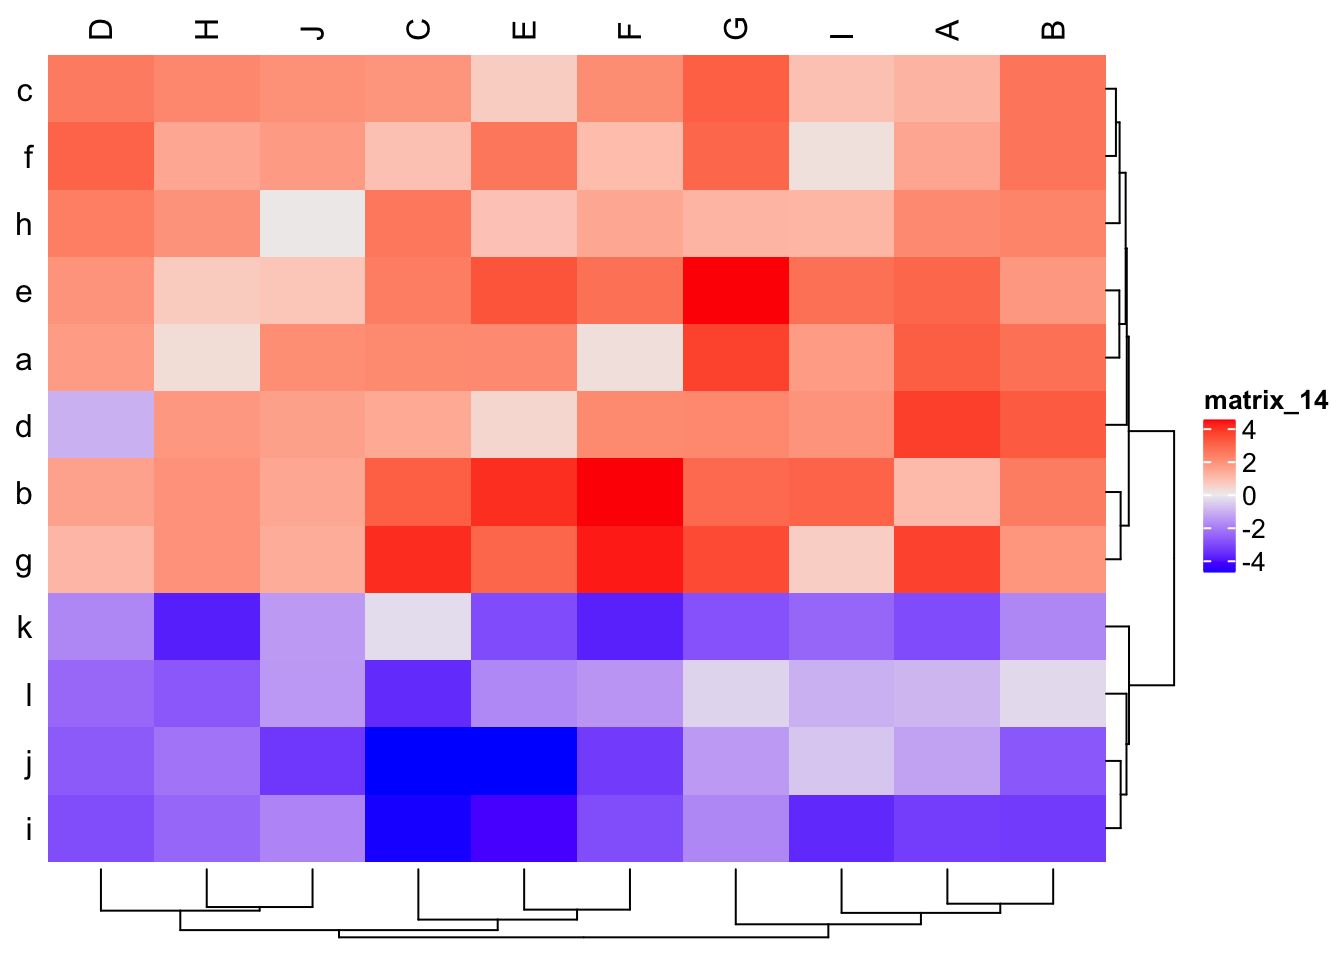
# row_names_side和column_names_side参数设置行名和列名存放的位置
Heatmap(mat, row_names_side = "left", row_dend_side = "right",
        column_names_side = "top", column_dend_side = "bottom")
# show_row_names参数设定是否显示行名,show_row_dend参设设定是否显示行聚类树
Heatmap(mat, show_row_names = FALSE, show_row_dend = FALSE)
# row_names_gp参数设定行名文本的格式
Heatmap(mat, row_names_gp = gpar(fontsize = 20, fontface="italic", col="red"))
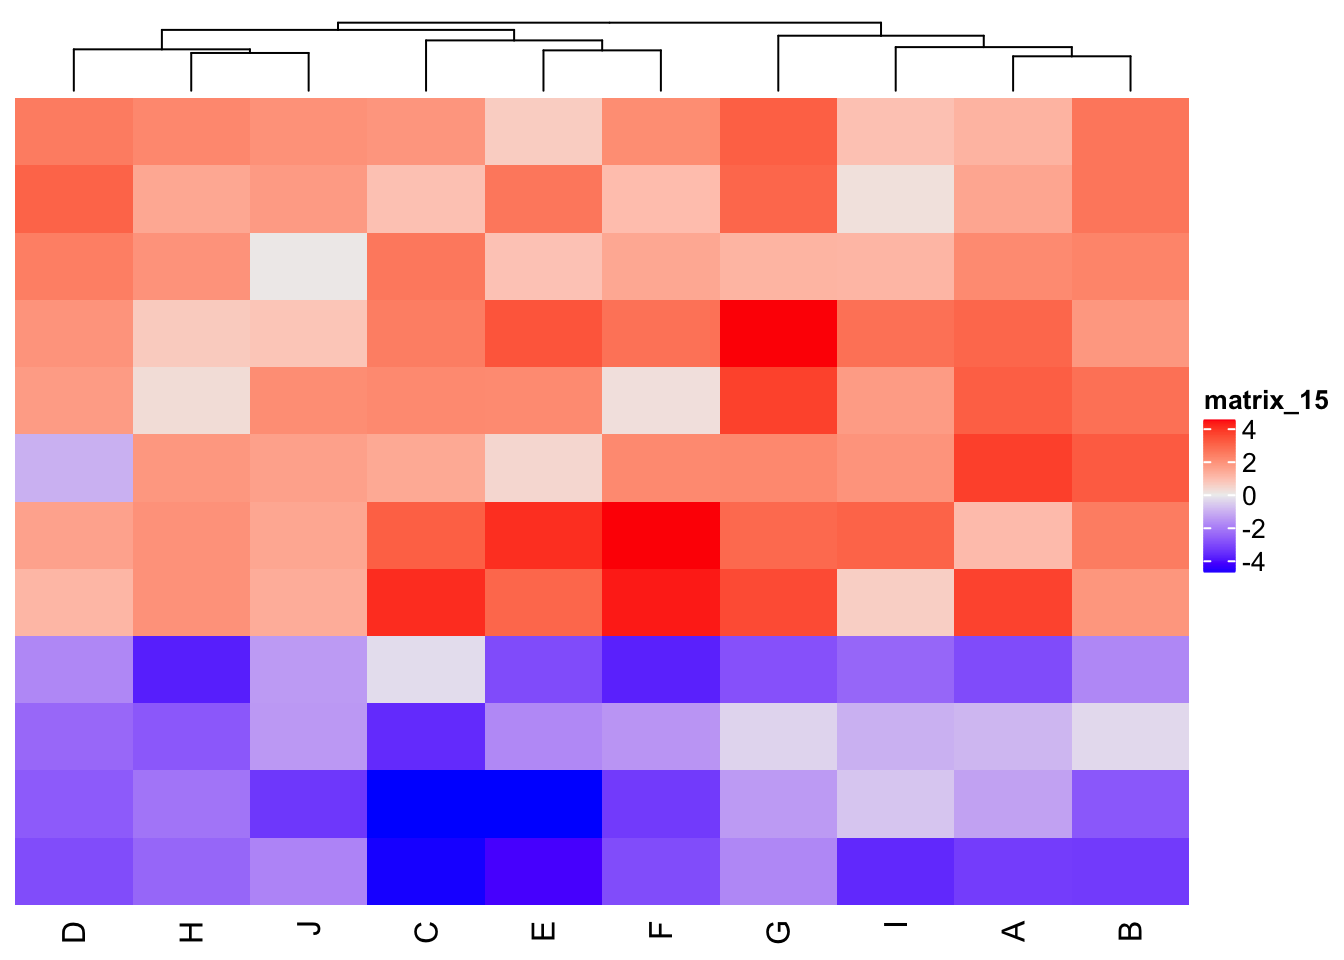
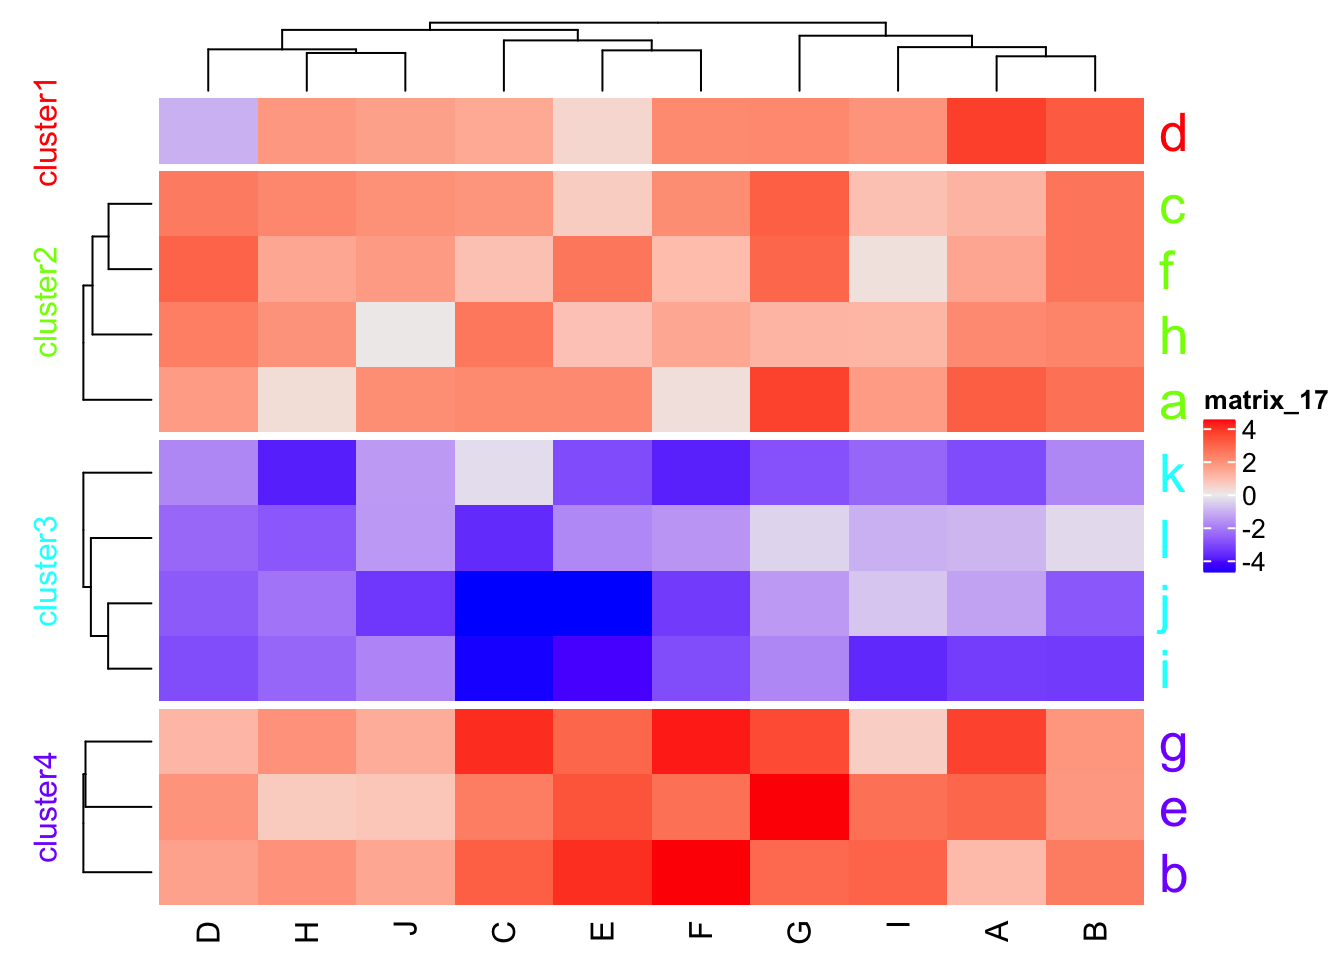
# km参数设定对行进行kmeans聚类分组的类数
Heatmap(mat, km = 4, row_title_gp = gpar(col=rainbow(4)), row_names_gp = gpar(col=rainbow(4), fontsize=20))
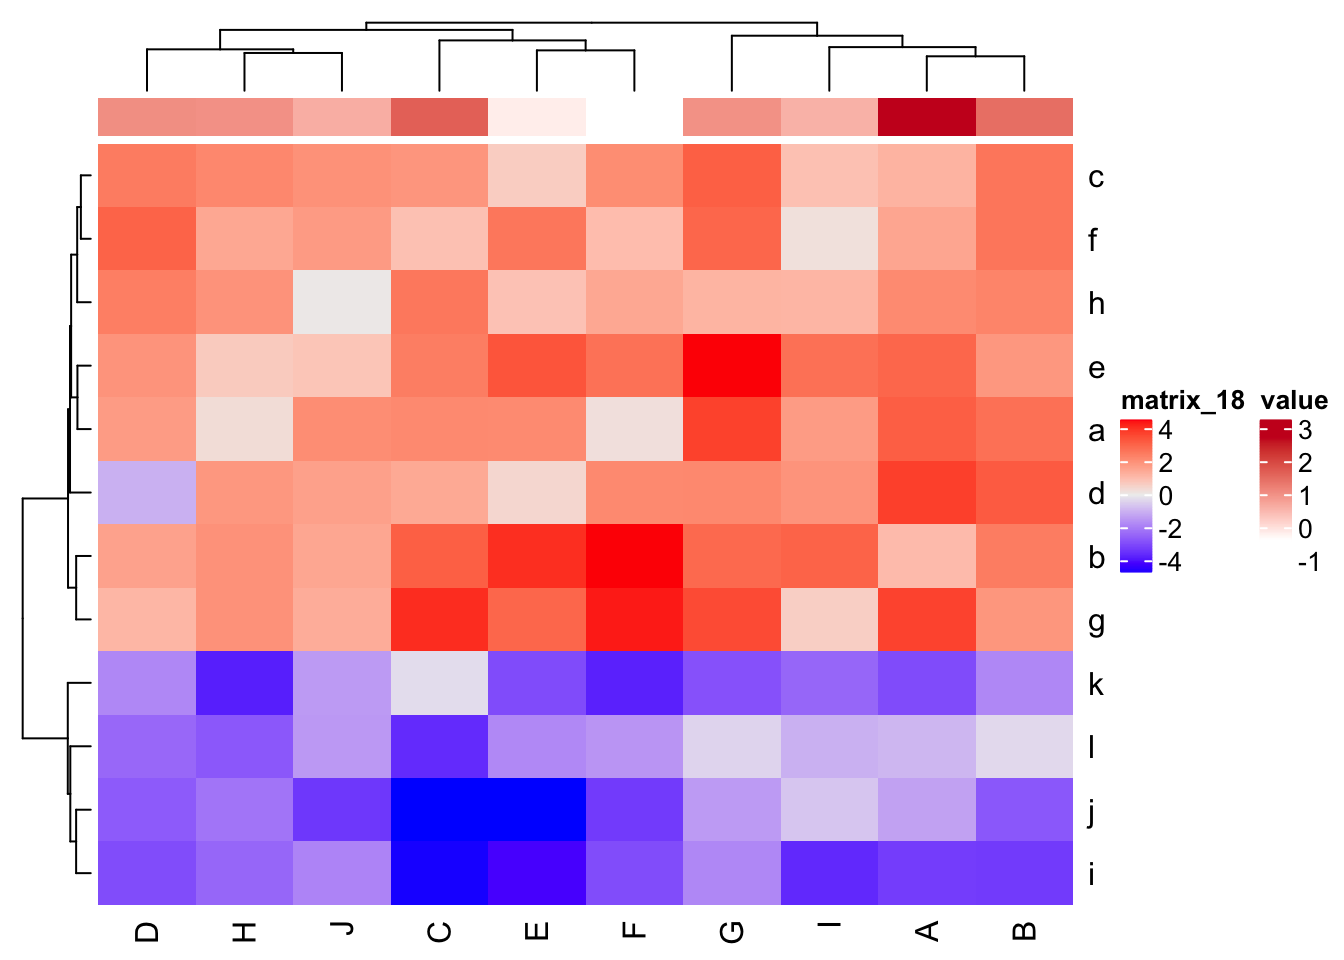
使用HeatmapAnnotation函数构建注释对象
annotation = data.frame(value = rnorm(10))
annotation = HeatmapAnnotation(df = annotation)
# top_annotation参数在顶部添加注释信息
Heatmap(mat, top_annotation = annotation)
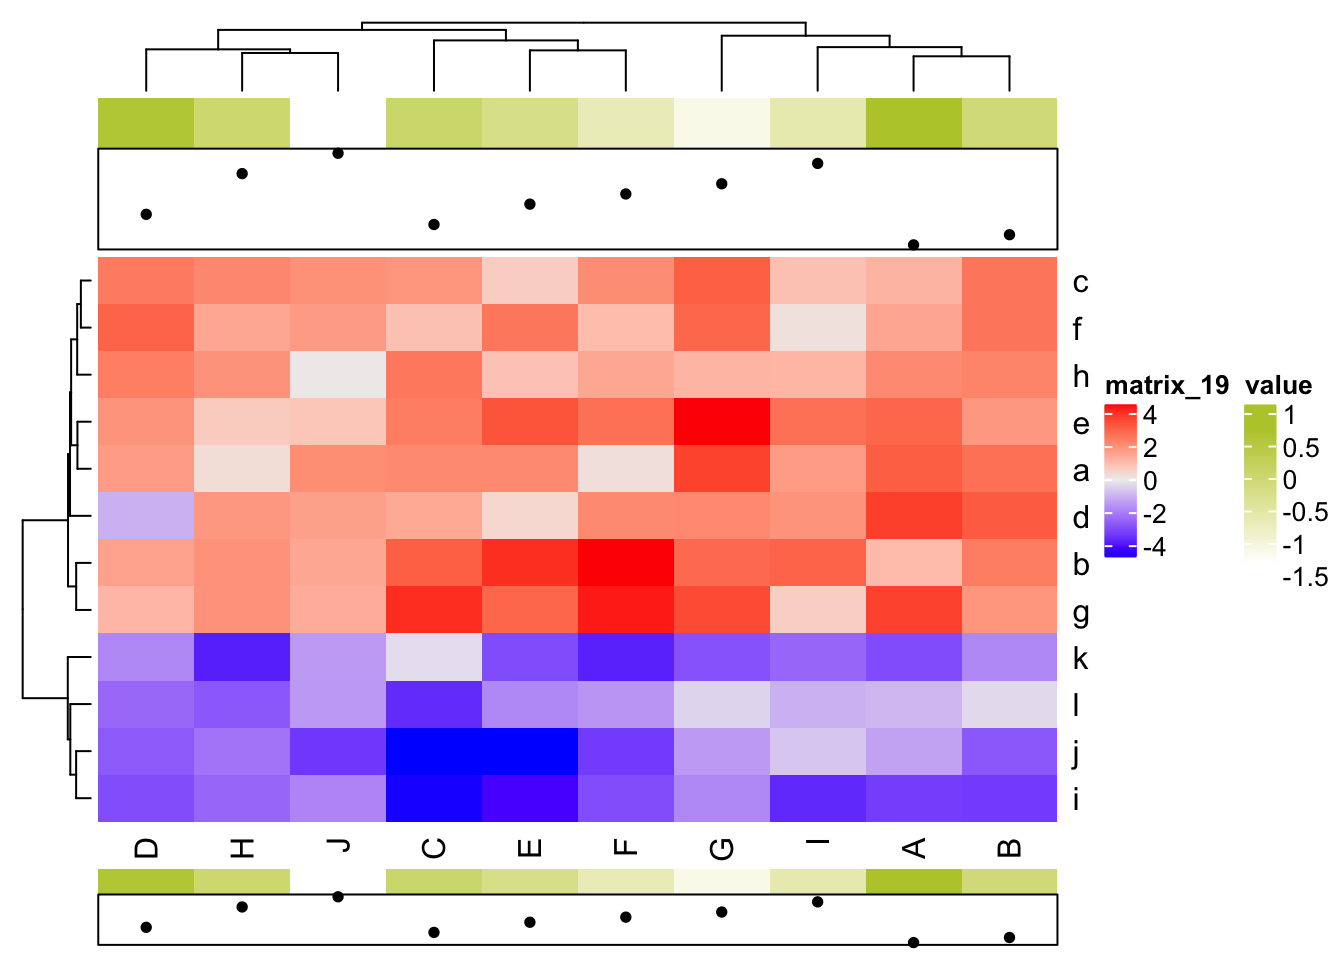
annotation = data.frame(value = rnorm(10))
value = 1:10
ha = HeatmapAnnotation(df = annotation, points = anno_points(value),
                       annotation_height = c(1, 2))
# top_annotation_height参数设定顶部注释信息展示的高度
Heatmap(mat, top_annotation = ha, top_annotation_height = unit(2, "cm"),
        bottom_annotation = ha)
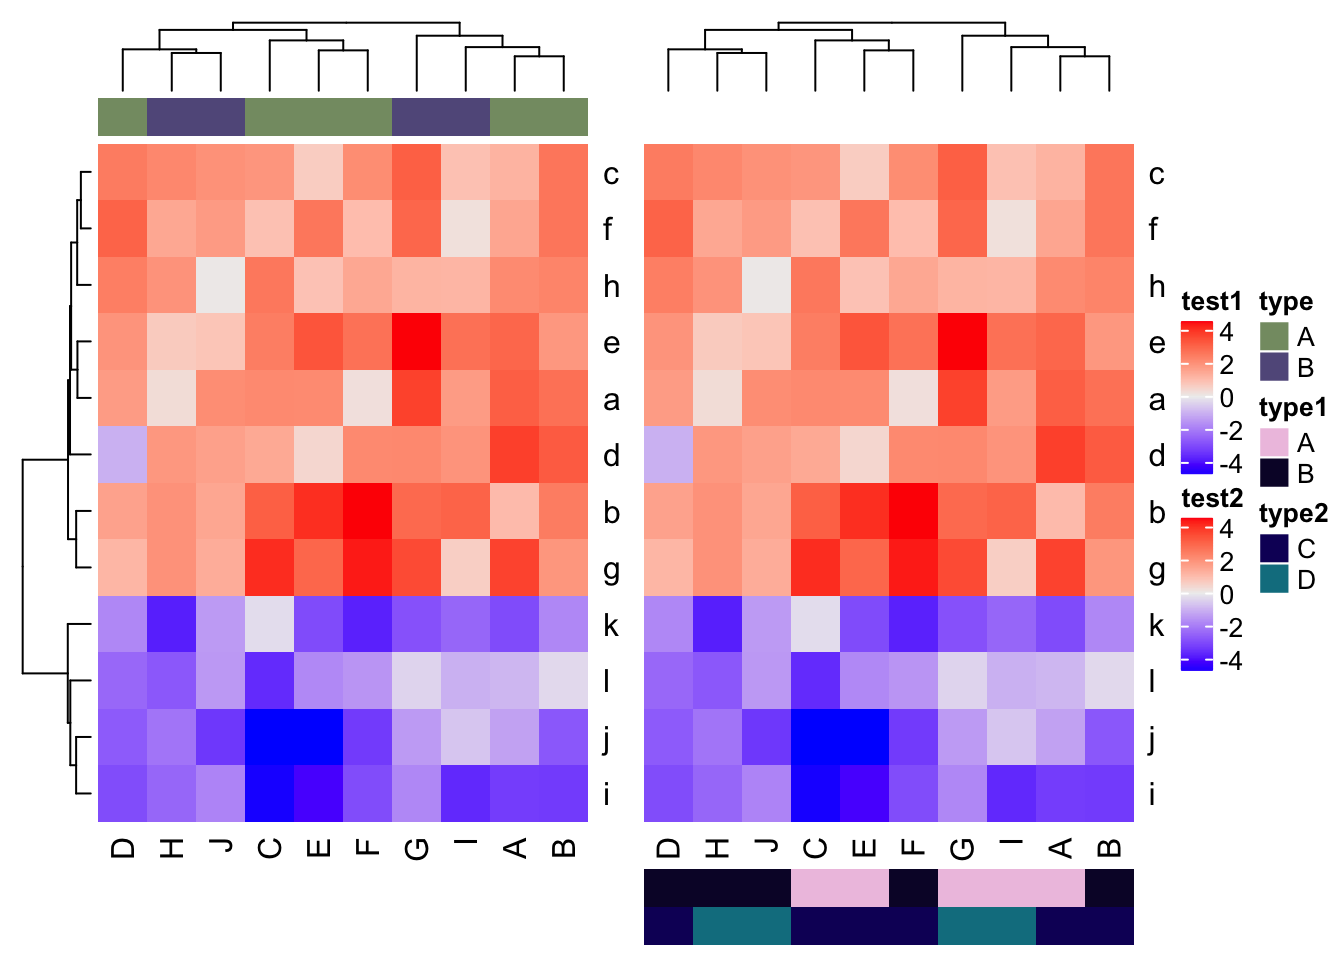
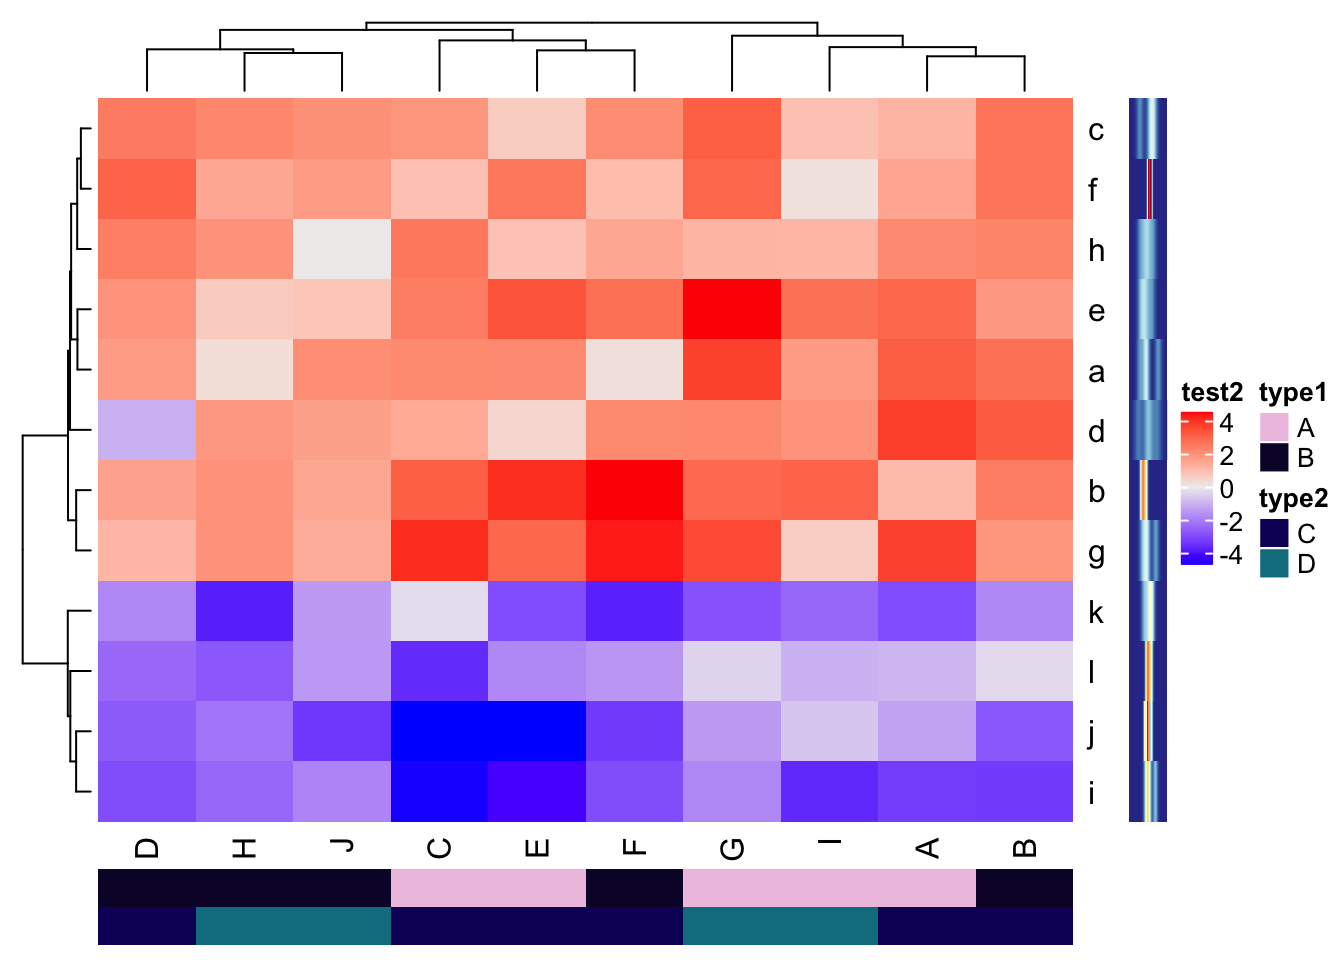
使用add_heatmap函数组合多个热图或注释信息
annotation1 = HeatmapAnnotation(df = data.frame(type = c(rep("A", 6), rep("B", 6))))
ht1 = Heatmap(mat, name = "test1", top_annotation = annotation1)

annotation2 = HeatmapAnnotation(df = data.frame(type1 = rep(c("A", "B"), 6),
                                               type2 = rep(c("C", "D"), each = 6)))
ht2 = Heatmap(mat, name = "test2", bottom_annotation = annotation2)
add_heatmap(ht1, ht2)
# 添加point注释信息
ha = HeatmapAnnotation(points = anno_points(1:12, which = "row",gp= gpar(col=rainbow(12))), which = "row")
add_heatmap(ht1, ha)
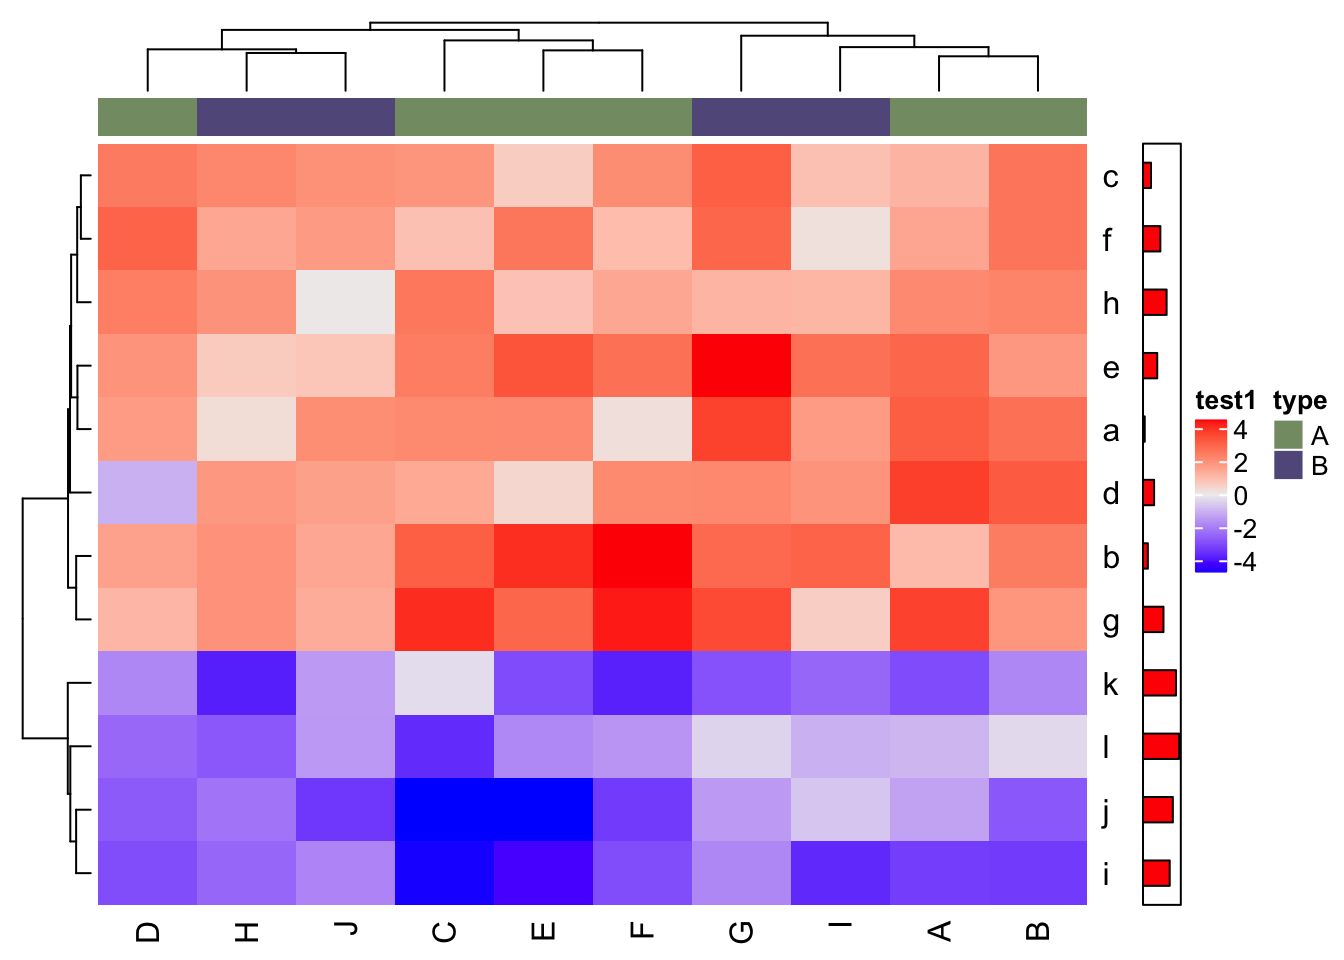
# 添加barplot注释信息
ha = HeatmapAnnotation(barplot = anno_barplot(1:12, which = "row", bar_width=0.4, gp= gpar(fill="red")), which = "row")
add_heatmap(ht1, ha)
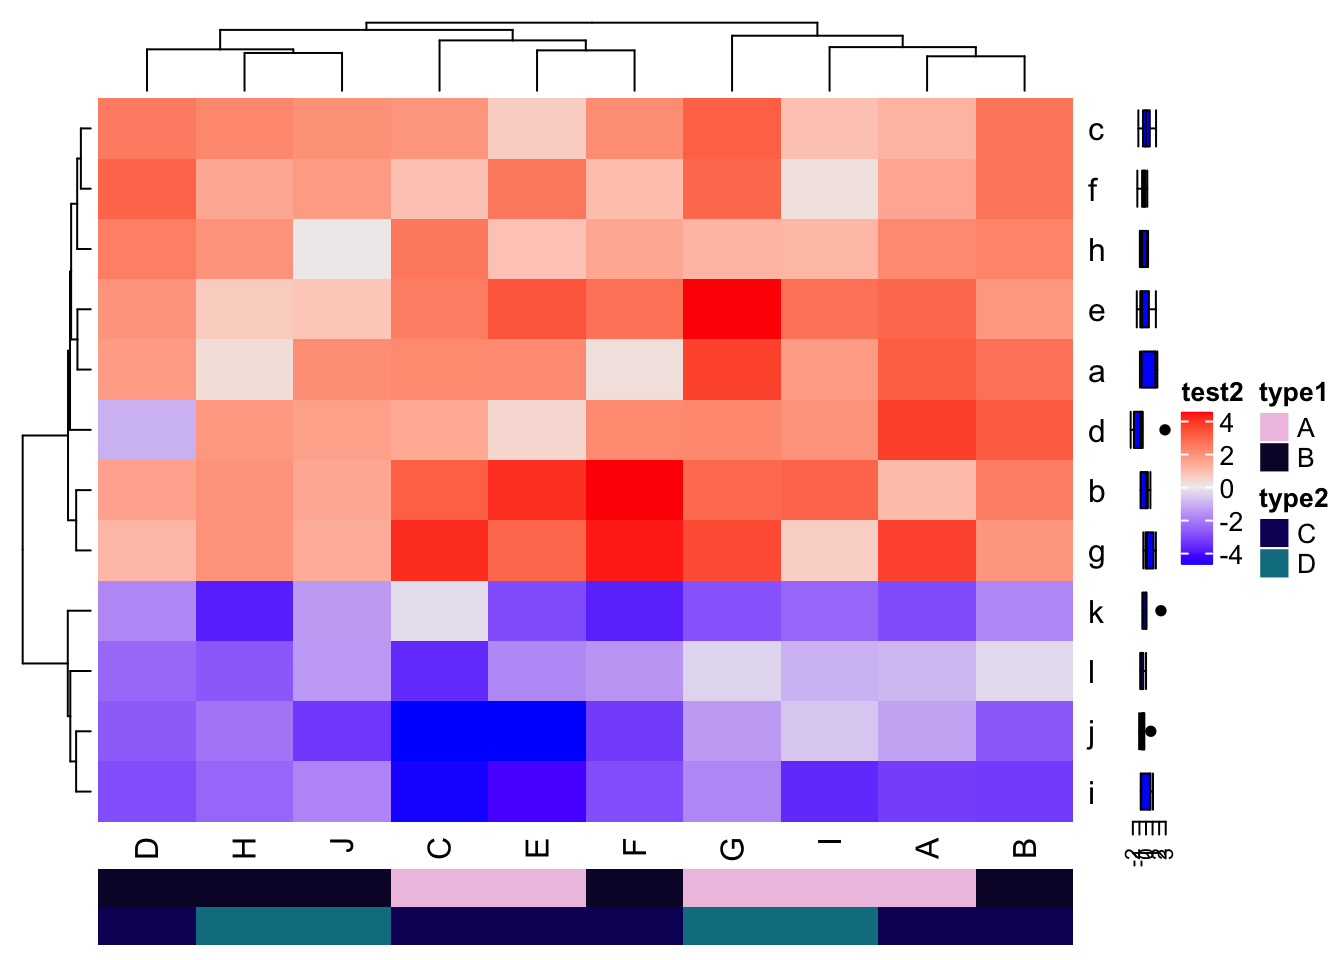
# 添加boxplot注释信息
ha = HeatmapAnnotation(boxplot = anno_boxplot(matrix(rnorm(60), nrow=12), which = "row", border = F, gp= gpar(fill="blue")), which = "row")
add_heatmap(ht2, ha)
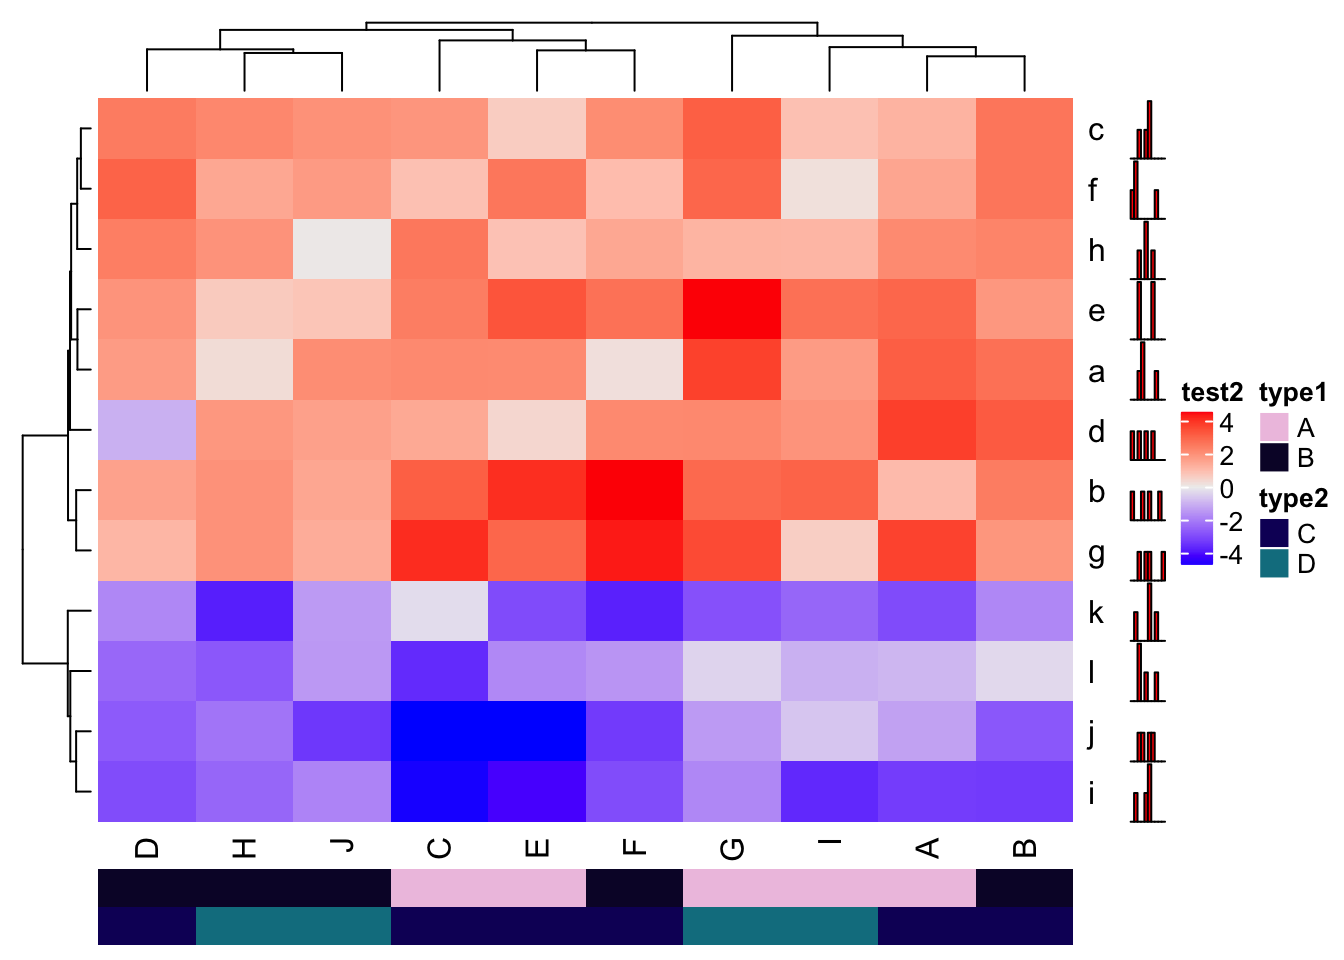
# 添加histogram注释信息
ha = HeatmapAnnotation(histogram = anno_histogram(matrix(rnorm(48), nrow=12), which = "row", gp= gpar(fill="red")), which = "row")
add_heatmap(ht2, ha)
# 添加density注释信息
ha = HeatmapAnnotation(density = anno_density(matrix(rnorm(48), nrow=12), which = "row", type="heatmap"), which = "row")
add_heatmap(ht2, ha)
row_order和column_order函数获得热图聚类后行和列对应的顺序
row_order(ht1) #得到一个列表
## [[1]]
##  [1]  3  6  8  5  1  4  2  7 11 12 10  9
column_order(ht1) #得到一个向量
## [1] 4 8 10 3 5 6 7 9 1 2
mat[row_order(ht1)[[1]],]
##            A          B          C          D          E          F
## c  1.0953206  2.3415277  1.7046930  2.2206123  0.5952640  1.8767222
## f  1.3739374  2.3319679  0.8226535  2.6943106  2.3148574  0.8938749
## h  1.9212146  2.0554681  2.2984488  2.1626922  0.7940837  1.3331693
## e  2.6451243  1.6655977  2.1922587  1.7396285  2.9845466  2.4252669
## a  2.8012969  2.4489591  1.9428114  1.5604724  1.9177726  0.2158233
## d  3.3537403  2.8541834  1.2874279 -0.8889426  0.3848691  1.9383945
## b  0.9418123  2.2093057  2.7862192  1.4398838  3.6213657  4.2668243
## g  3.2939952  1.6930804  3.6404261  1.0191843  2.6318222  3.8651897
## k -2.6225943 -1.5660520 -0.2162833 -1.5654904 -2.6135985 -3.3150684
## l -0.8009785 -0.2694706 -3.1642354 -2.1123275 -1.5482925 -1.3466843
## j -1.1355446 -2.4070908 -4.2075492 -2.3396374 -4.3409680 -2.9145455
## i -2.8700744 -2.9040941 -4.1061353 -2.6059058 -3.6201093 -2.5930123
##           G          H          I           J
## c  2.788628  1.9808171  0.8263468  1.78521698
## f  2.646258  1.3369390  0.2074835  1.58720410
## h  1.075480  1.7551531  1.0493876  0.04447524
## e  4.630288  0.6262087  2.4486098  0.73093658
## a  3.317781  0.2706951  1.5700012  1.87109836
## d  1.960331  1.6676294  1.7265879  1.47628891
## b  2.577691  1.7695180  2.6903054  1.34627848
## g  3.161174  1.7733364  0.5466857  1.22953346
## k -2.512614 -3.3644992 -2.1460842 -1.25187852
## l -0.344318 -2.3971692 -0.8973583 -1.29018334
## j -1.245340 -1.8870998 -0.5708714 -2.97128660
## i -1.561022 -2.1474388 -3.2070408 -1.63078877
mat[,column_order(ht1)]
##            D          H           J          C          E          F
## a  1.5604724  0.2706951  1.87109836  1.9428114  1.9177726  0.2158233
## b  1.4398838  1.7695180  1.34627848  2.7862192  3.6213657  4.2668243
## c  2.2206123  1.9808171  1.78521698  1.7046930  0.5952640  1.8767222
## d -0.8889426  1.6676294  1.47628891  1.2874279  0.3848691  1.9383945
## e  1.7396285  0.6262087  0.73093658  2.1922587  2.9845466  2.4252669
## f  2.6943106  1.3369390  1.58720410  0.8226535  2.3148574  0.8938749
## g  1.0191843  1.7733364  1.22953346  3.6404261  2.6318222  3.8651897
## h  2.1626922  1.7551531  0.04447524  2.2984488  0.7940837  1.3331693
## i -2.6059058 -2.1474388 -1.63078877 -4.1061353 -3.6201093 -2.5930123
## j -2.3396374 -1.8870998 -2.97128660 -4.2075492 -4.3409680 -2.9145455
## k -1.5654904 -3.3644992 -1.25187852 -0.2162833 -2.6135985 -3.3150684
## l -2.1123275 -2.3971692 -1.29018334 -3.1642354 -1.5482925 -1.3466843
##           G          I          A          B
## a  3.317781  1.5700012  2.8012969  2.4489591
## b  2.577691  2.6903054  0.9418123  2.2093057
## c  2.788628  0.8263468  1.0953206  2.3415277
## d  1.960331  1.7265879  3.3537403  2.8541834
## e  4.630288  2.4486098  2.6451243  1.6655977
## f  2.646258  0.2074835  1.3739374  2.3319679
## g  3.161174  0.5466857  3.2939952  1.6930804
## h  1.075480  1.0493876  1.9212146  2.0554681
## i -1.561022 -3.2070408 -2.8700744 -2.9040941
## j -1.245340 -0.5708714 -1.1355446 -2.4070908
## k -2.512614 -2.1460842 -2.6225943 -1.5660520
## l -0.344318 -0.8973583 -0.8009785 -0.2694706
# 得到热图聚类后顺序的数据
mat1 = mat[row_order(ht1)[[1]],column_order(ht1)]
write.table(mat1,file="reorder.txt",quote = FALSE,sep='\t')  #输出结果,按照热图中的顺序
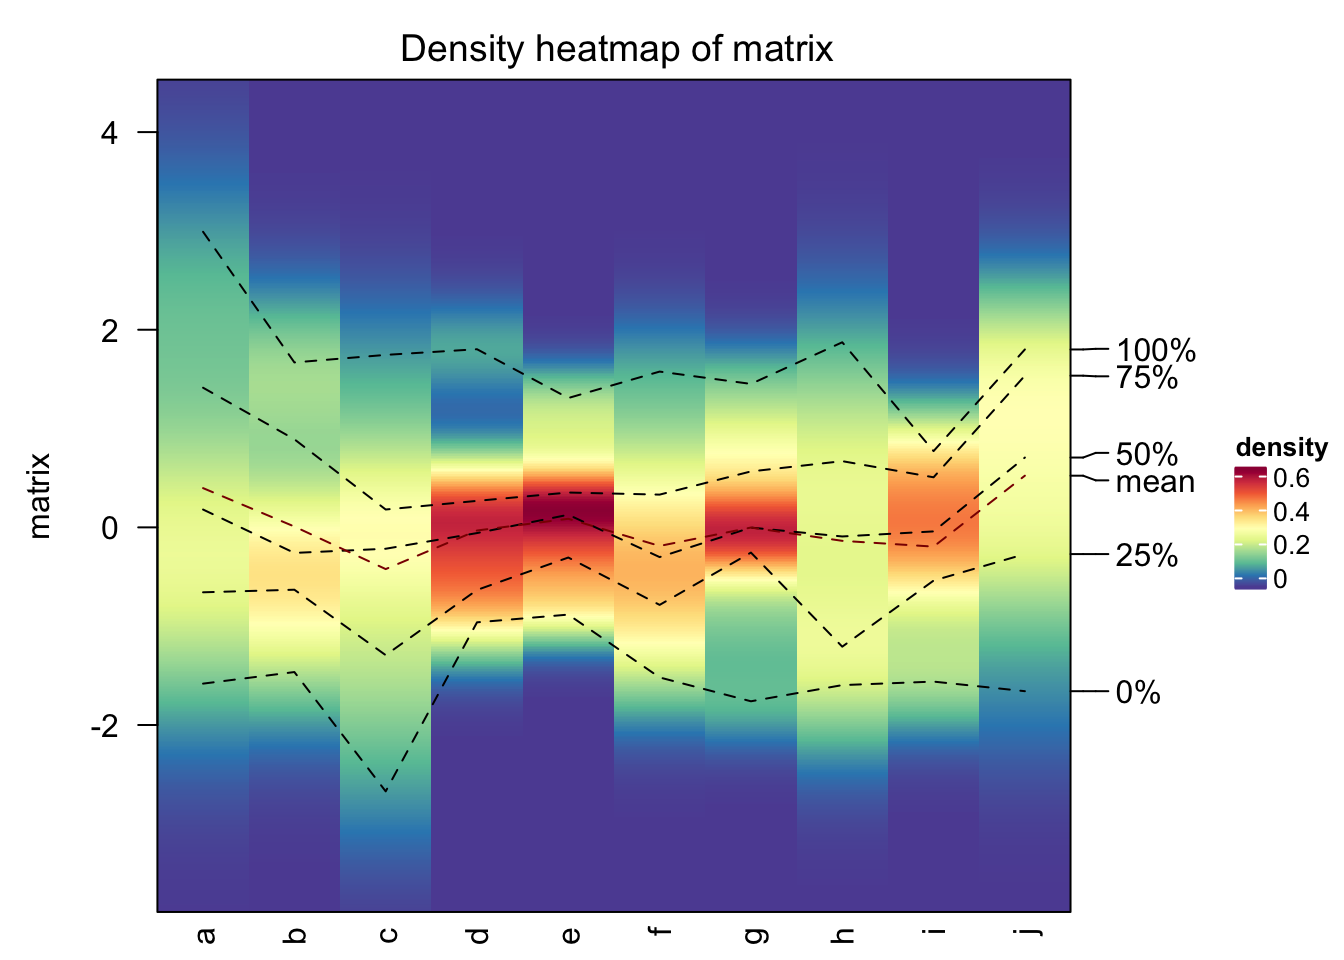
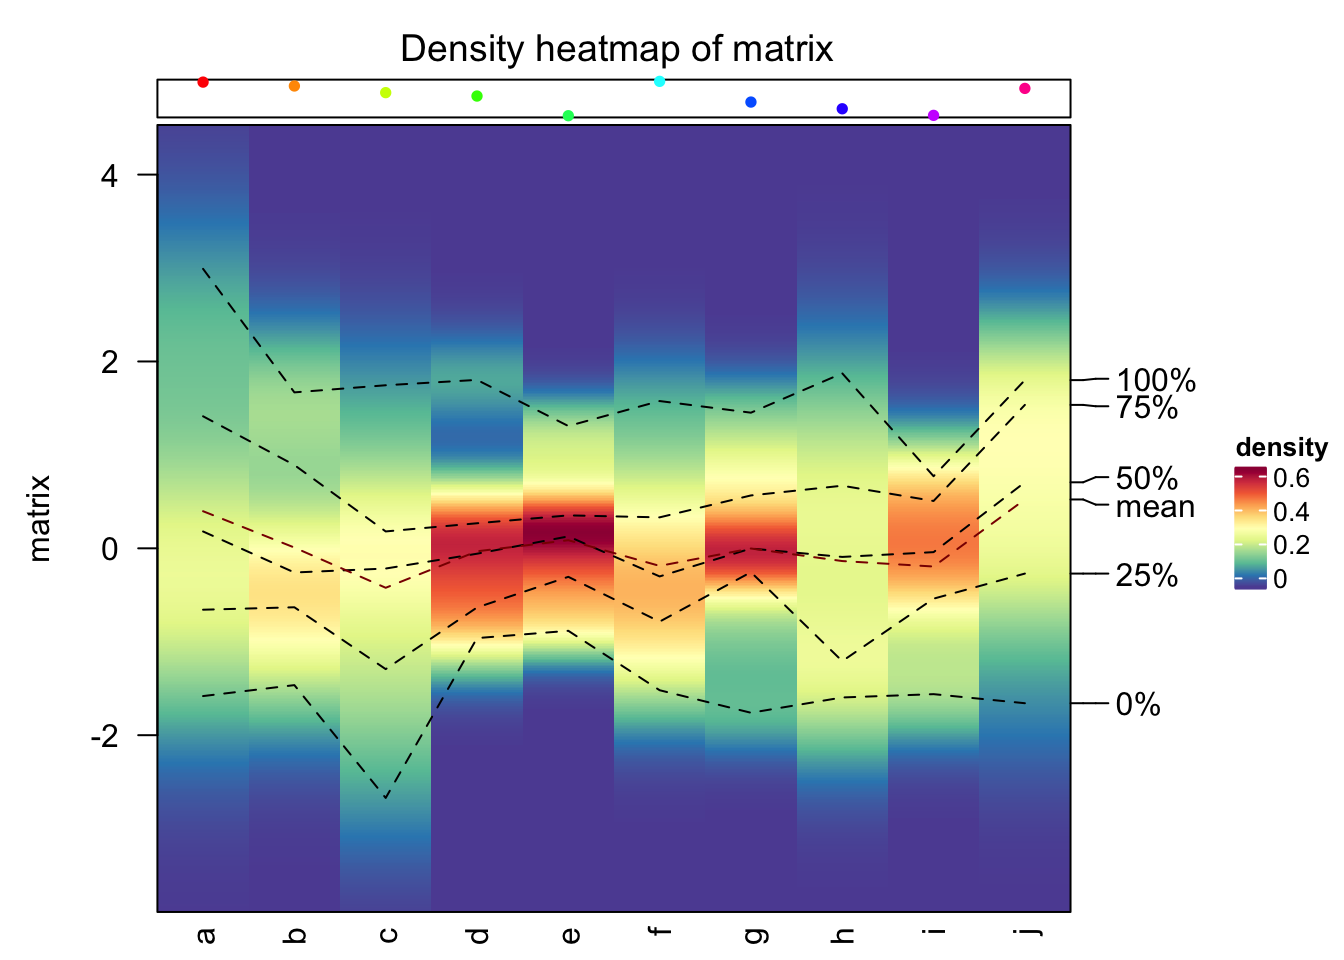
使用densityHeatmap函数绘制密度热图
# 构建测试数据集
matrix = matrix(rnorm(100), 10); colnames(matrix) = letters[1:10]
# 默认不对列进行聚类,不显示聚类树
densityHeatmap(matrix)
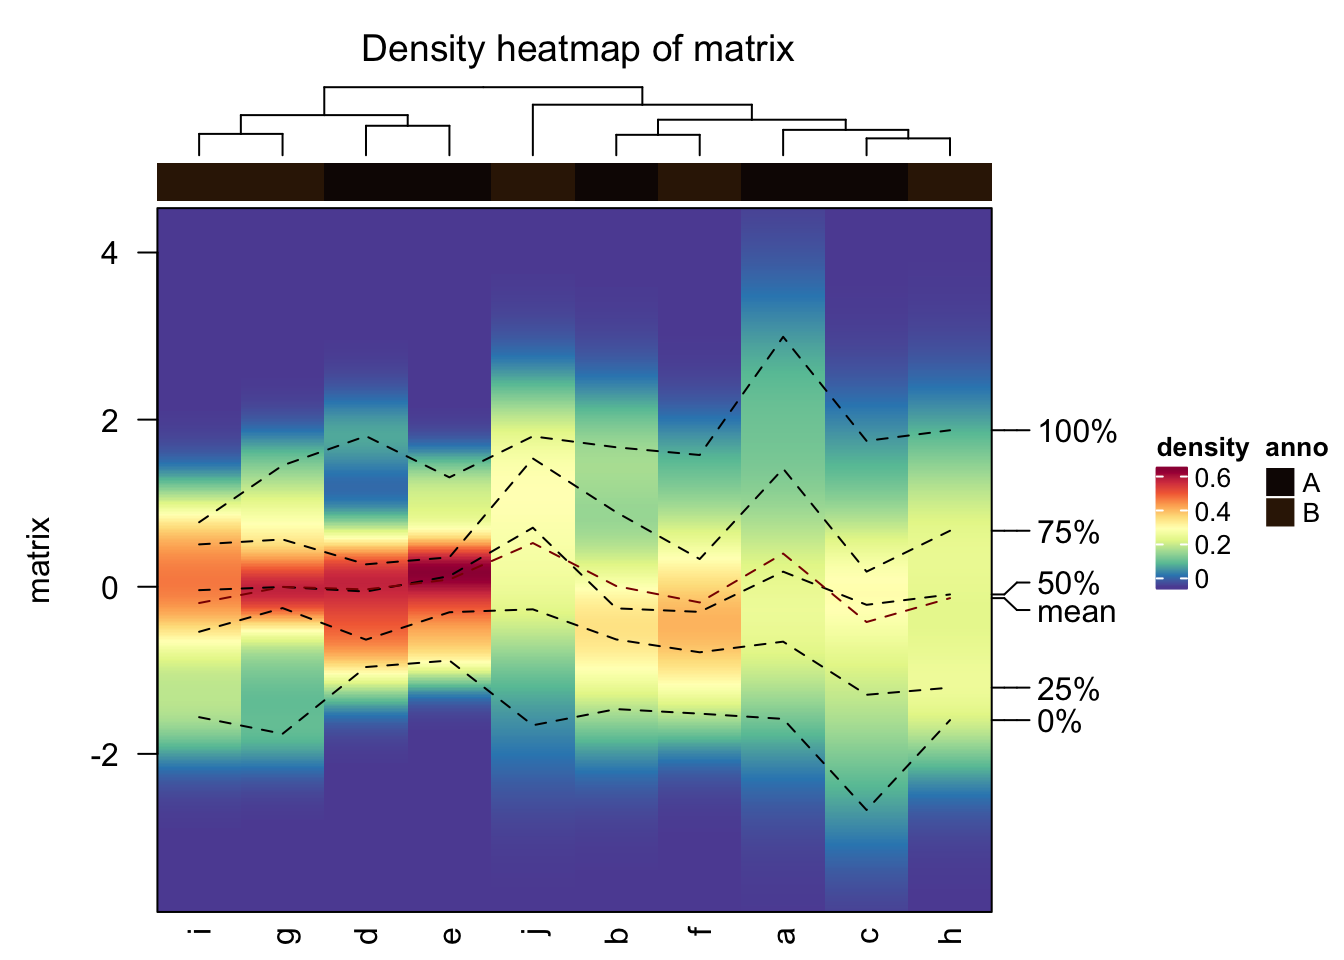
# anno参数添加注释信息
densityHeatmap(matrix, anno = rep(c("A", "B"), each = 5), cluster_columns = T, show_column_dend = T)
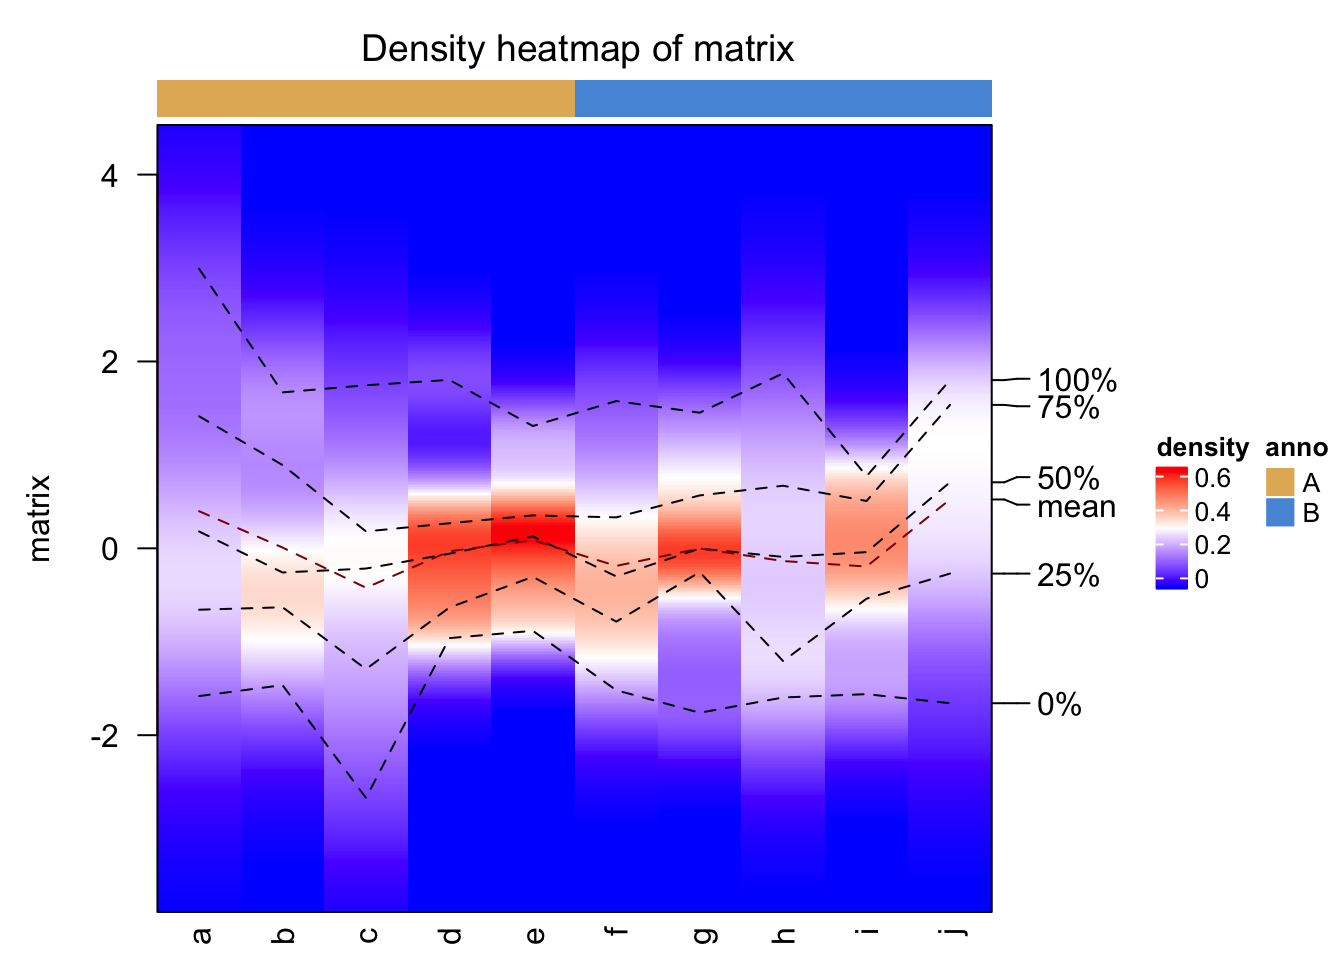
# col参数自定义颜色
densityHeatmap(matrix, col = c("blue", "white", "red"), anno = rep(c("A", "B"), each = 5))
# 构建注释对象
ha = HeatmapAnnotation(points = anno_points(runif(10), gp=gpar(col=rainbow(10))))
densityHeatmap(matrix, anno = ha)
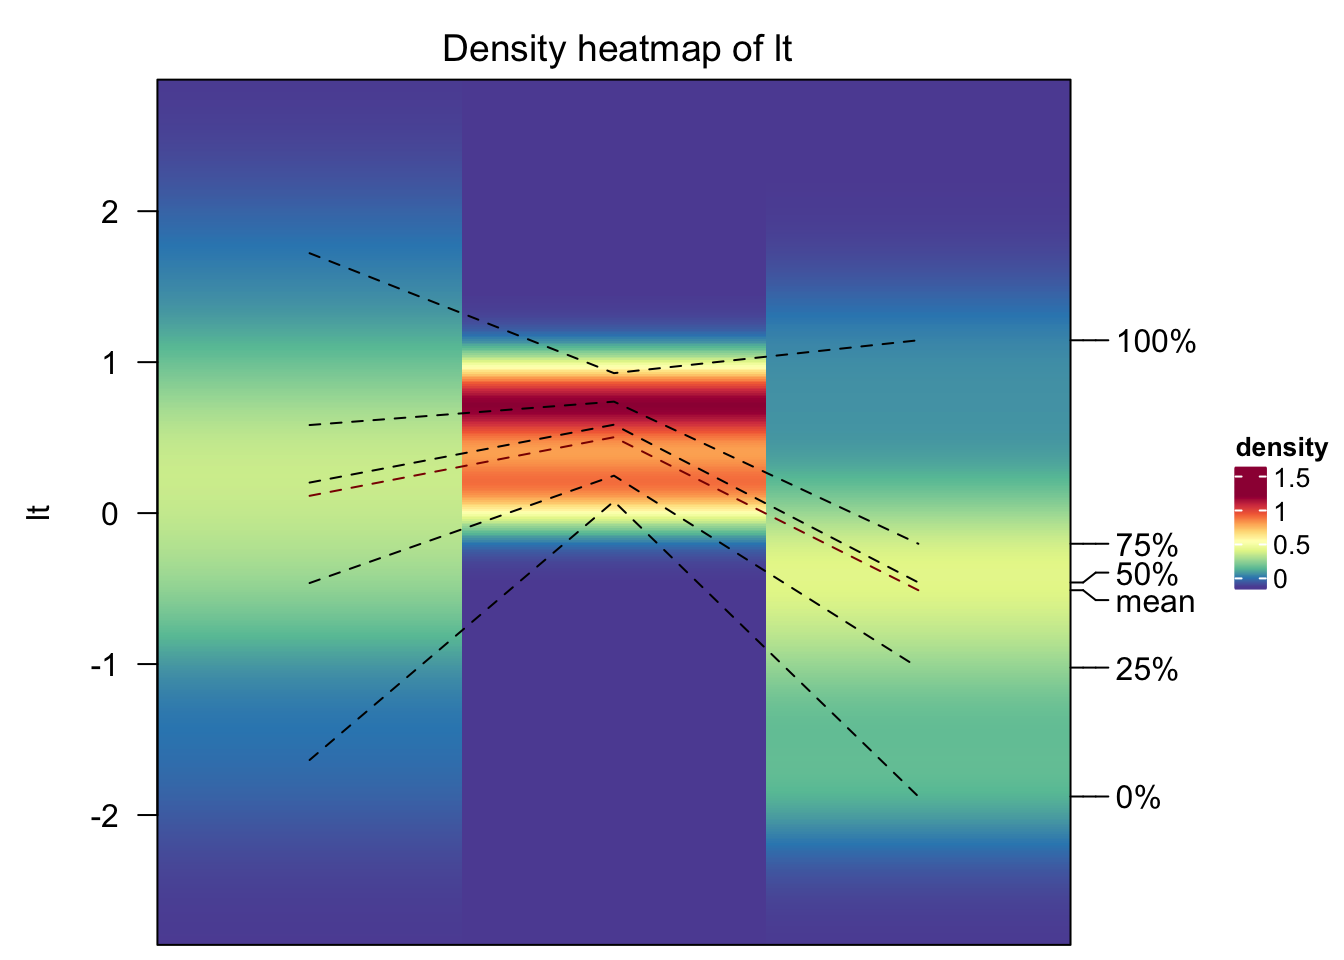
# 构建一个list
lt = list(rnorm(10), runif(10), rnorm(10))
densityHeatmap(lt)
sessionInfo()
## R version 3.5.1 (2018-07-02)
## Platform: x86_64-apple-darwin15.6.0 (64-bit)
## Running under: OS X El Capitan 10.11.3
##
## Matrix products: default
## BLAS: /Library/Frameworks/R.framework/Versions/3.5/Resources/lib/libRblas.0.dylib
## LAPACK: /Library/Frameworks/R.framework/Versions/3.5/Resources/lib/libRlapack.dylib
##
## locale:
## [1] zh_CN.UTF-8/zh_CN.UTF-8/zh_CN.UTF-8/C/zh_CN.UTF-8/zh_CN.UTF-8
##
## attached base packages:
## [1] grid      stats     graphics  grDevices utils     datasets  methods
## [8] base
##
## other attached packages:
## [1] circlize_0.4.4        ComplexHeatmap_1.18.1
##
## loaded via a namespace (and not attached):
##  [1] Rcpp_0.12.18        digest_0.6.16       rprojroot_1.3-2
##  [4] backports_1.1.2     magrittr_1.5        evaluate_0.11
##  [7] stringi_1.2.4       GlobalOptions_0.1.0 GetoptLong_0.1.7
## [10] rmarkdown_1.10      RColorBrewer_1.1-2  rjson_0.2.20
## [13] tools_3.5.1         stringr_1.3.1       yaml_2.2.0
## [16] compiler_3.5.1      colorspace_1.3-2    shape_1.4.4
## [19] htmltools_0.3.6     knitr_1.20