

这一篇会在之前的基础上开始在circos绘制基因密度信息。为了保证一致性,可以新建如下几个文件
circos.conf:
karyotype = karyotype.tair10.txt

chromosomes_color = chr1=rdylbu-11-div-1,chr2=rdylbu-11-div-3,chr3=rdylbu-11-div-5,chr4=rdylbu-11-div-7,chr5=rdylbu-11-div-9

chromosomes_units = 1000000
<<include ticks.conf>>

<ideogram>
<spacing>
default = 0.005r
</spacing>
radius           = 0.90r
thickness        = 20p
fill             = yes
stroke_color     = dgrey
stroke_thickness = 2p

show_label     = yes #展示label
label_font     = default # 字体
label_radius   = dims(ideogram,radius) + 0.05r #位置
label_size     = 16 # 字体大小
label_parallel = yes # 是否平行

label_format   = eval(sprintf("%s",var(chr))) # 格式
</ideogram>

<image>
dir*    = .    # 输出文件夹
radius* = 500p # 图片半径
svg*    = no   # 是否输出svg
<<include etc/image.conf>>
</image>

<<include etc/colors_fonts_patterns.conf>>
<<include etc/housekeeping.conf>>
karyotype.tair10.txt
chr - chr1 chr1 0 30427617 chr1
chr - chr2 chr2 0 19698289 chr2
chr - chr3 chr3 0 23459830 chr3
chr - chr4 chr4 0 18585056 chr4
chr - chr5 chr5 0 26975502 chr5
ticks.conf
show_ticks          = yes
show_tick_labels    = yes

<ticks>

radius           = 1r
color            = black
thickness        = 2p
multiplier       = 1e-6
format           = %d

<tick>
spacing        = 1u
size           = 5p
</tick>

<tick>
thickness      = 4p
spacing        = 5u
size           = 10p
show_label     = yes
label_size     = 10p
label_offset   = 10p
format         = %d
</tick>

</ticks>
在开始之前,请确保已经安装了bedtools,如果没有的话,用conda安装
# 安装bedtools
conda install -c bioconda bedtools
数据格式
为了能够在circos绘制基因密度信息,需要先知道circos要求的输入数据格式是什么。
对于折线图(line),散点图(scatter),柱状图(histogram)和热图(heatmap),Circos要求的数据输入格式相同,也就是chr start end value [options], 如果熟悉BED格式定义的话,你就会发现除了可选(options)外,Circos要求的格式就是4列的BED。
对于可选列,可以和circos.conf里的搭配使用,属于比较高级的用法。
数据预处理
为了能够获得所需的基因密度信息,我们需要下载拟南芥的GFF文件。
# download
wget ftp://ftp.ensemblgenomes.org/pub/plants/release-44/gff3/arabidopsis_thaliana/Arabidopsis_thaliana.TAIR10.44.gff3.gz
提取基因的位置信息
zgrep '[[:blank:]]gene[[:blank:]]' Arabidopsis_thaliana.TAIR10.44.gff3.gz | cut -f 1,4,5 | awk '{print "chr"$1"t"$2"t"$3}' > genes.bed
接着用bedtools以500kb为滑窗,沿染色体创建窗口
cut -d ' ' -f 3,6 karyotype.tair10.txt | tr ' ' 't' > tair10.genome
bedtools makewindows -g tair10.genome -w 500000 > tair10.windows
最后统计信息
bedtools coverage -a tair10.windows -b genes.bed | cut -f 1-4 > genes_num.txt
展示信息
我们可以先用最少的参数,同时展示不同的图形。
...
<plots>

<plot>
type      = line
thickness = 2
max_gap = 1u
file = genes_num.txt
color   = redv
r0      = 0.51r
r1      = 0.60r
</plot>

<plot>
type    = heatmap
file    = genes_num.txt
color   = spectral-5-div
r1      = 0.70r
r0      = 0.61r
</plot>

<plot>
type = scatter
fill_color       = grey
stroke_color     = black
glyph            = circle
glyph_size       = 10
file = genes_num.txt
r1   = 0.80r
r0   = 0.71r
</plot>

<plot>
type = histogram
file = genes_num.txt
r1   = 0.89r
r0   = 0.81r
</plot>

</plots>
...
运行之后,效果如下
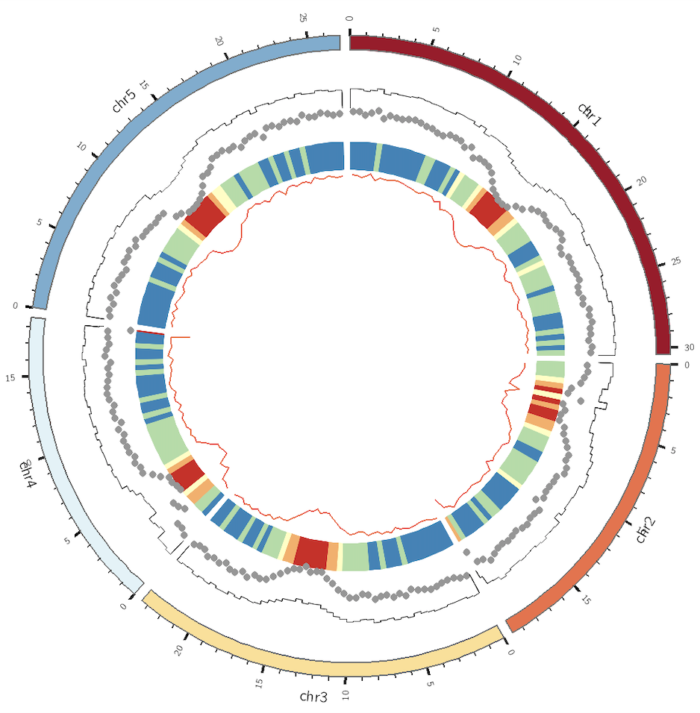
这张图展示了巨大的进步空间,至少可以从如下几个角度进行调整,
- 柱状图有点丑,需要填充颜色
- 热图的颜色不符合直觉,基因数越少反而颜色越深
- 散点图的点太大
- 有些图形可能需要加上背景色。
- 对于一些过大的数值,最好用一种颜色表示。
当知道自己的目标后,后续的事情就是找对应参数和调整参数. 部分我用来调整参数如下
show- 是否展示该图形type- 展示的图形类型file- 输入的数据文件所在路径min/max- 数据范围r0/r1- 内径和外径,在圈图中的位置glyph- 对于散点图而言,还可以选择符号的类型,是circle, rectangle, 还是 triangleglyph_size- 符号的大小,单位为pcolor散点图符号颜色,柱状图外部线的颜色stroke_color- 对于散点图,符号外部是否也要颜色stroke_thickness- 对于散点图,符号外部线的厚度fill_color:柱状图填充色
调整后的参数为
...
<plots>

<plot>
type    = heatmap
file    = genes_num.txt
color   = blues-9-seq
r1      = 0.70r
r0      = 0.61r
</plot>

<plot>
type = scatter
fill_color       = black # 填充色
stroke_color     = black
glyph            = circle
glyph_size       = 5 # 元素大小
file = genes_num.txt
r1   = 0.80r
r0   = 0.71r
</plot>

<plot>
type = histogram
file = genes_num.txt
fill_color = blue # 填充色
r1   = 0.89r
r0   = 0.81r
</plot>

</plots>
...
图形效果如下
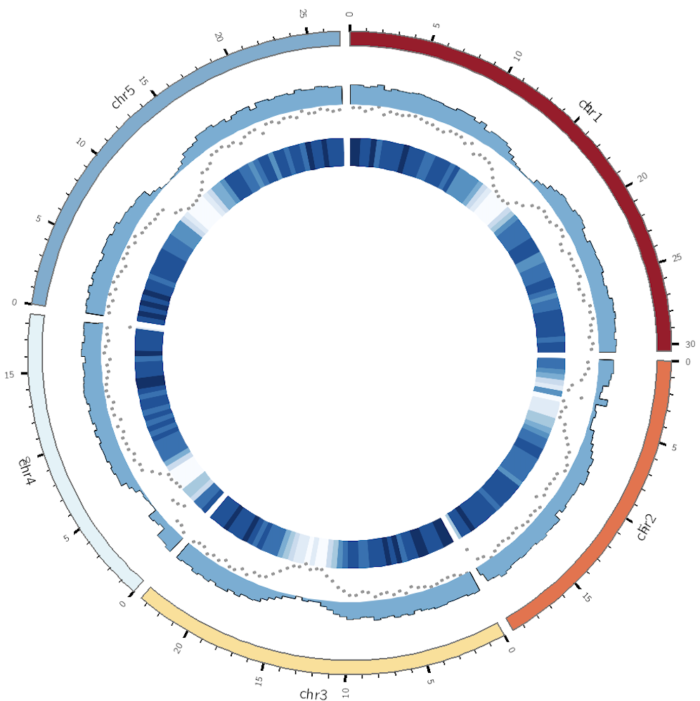
这个效果我个人还是比较满意的。更加复杂的设置,目前还不适合我,需要一步一步来。