

1. 背景知识
净重新分类指数(NRI)这个指标最初用于评价诊断试验中新的诊断指标较旧诊断指标把研究对象进行正确分类在数量上的变化。既然可以评估诊断试验预测的准确度,那自然也可以用于判断预测模型的准确度,从已发表的临床研究文献来看,NRI这个指标更广泛应用于比较两个预测模型的准确度。前文已经述及比较两个预测模型的准确性或者区分度的方法,一般计算C-statistics,或者叫ROC曲线下面积AUC,而C-statistics或AUC具有一定的局限性:
(1)C-statistics/AUC不够敏感,当我们想要在原有模型中引入新的指标后,观察模型的预测能力是否有所提高,此时新加入的指标有时很难显著改善C-statistics/AUC,其增量往往并不明显;
(2)C-statistics/AUC的专业意义不容易理解,很难转化为恰当的临床解释。而NRI很好的克服了这两个不足。
2. 计算原理
我们首先以二分类诊断指标为例讲解NRI大致计算原理,然后再将其扩展应用于预测模型预测能力的量化比较,前者一般手动计算即可,后者计算需借助统计软件。简单来讲,旧诊断指标会把研究对象分类为患者和非患者,而新的诊断指标会把研究对象再重新分类为患者和非患者。此时比较新、旧诊断指标对于研究人群的分类变化,就会发现有一部分研究对象,原本在旧诊断指标中被错分,但在新诊断指标中得到了正确划分;同样也有一部分研究对象,原本在旧诊断指标中分类正确,但在新诊断指标中却被错分,因此研究对象的分类在新、旧诊断指标中会发生变化,我们利用这种重新分类的变化,来计算净重新分类指数NRI[1,2]。文字读起来确实有点绕,可参考下面计算过程帮助消化。
首先我们将研究对象按照金标准的诊断结果分为患病和未患病两组,然后分别在这两个分组下,根据新、旧诊断指标的预测分类结果,整理成两个配对的四格表,如下表1.和表2.所示。
表1. 患病租重新分类表
| 患病组(N1) | 新指标 | |
| 旧指标 | 阳性 | 阴性 |
| 阳性 | a1 | b1 |
| 阴性 | c1 | d1 |
表2. 无病组重新分类表
| 无病组(N2) | 新指标 | |
| 旧指标 | 阳性 | 阴性 |
| 阳性 | a2 | b2 |
| 阴性 | c2 | d2 |
我们主要关注被重新分类的研究对象,从表中可以看出,在患病组(总数为N1),新诊断指标分类正确而旧指标分类错误的有c1个人,新指标分类错误而旧指标分类正确的有b1个人,那么新模型相对于旧模型来说,正确分类提高的比例为(c1-b1)/N1。同理,在非患者组(总数为N2),新诊断指标分类正确而旧指标分类错误的有b2个人,新指标分类错误而旧指标分类正确的有c2个人,那么新诊断指标相对于旧指标正确分类提高的比例为(b2-c2)/ N2。最后,综合患者组和非患者组的结果,新模型与旧模型相比,净重新分类指数NRI= (c1-b1)/N1+(b2-c2)/N2,一般称作绝对NRI。
若NRI>0,则为正改善,说明新指标比旧指标的预测能力有所改善;若NRI<0,则为负改善,新指标预测能力下降;若NRI=0,则认为新模型没有改善。我们可以通过计算Z统计量,来判断NRI与0相比是否具有统计学显著性,统计量Z近似服从正态分布,公式如下图1.,根据Z值可计算P值。
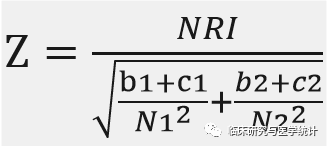
图1.NRI的Z统计量计算公式
以上是一个二分类诊断指标的例子,但在预测模型类研究中往往要更复杂,但基本原理是一样的。直接根据二分类诊断指标判断是否患病有时过于“简单粗暴”,研究人员可能更关注的是未来患病风险的大小而非简单的有病或者无病,而预测模型恰恰可以给出患病或者发生终点事件的概率。例如将研究对象根据预测的风险概率划分为低、中、高风险三组,可以更有针对性采取精准的干预措施。针对这种结局风险概率是三分类或者更多分类时,ROC分析就不太合适了,因为ROC分析的结局事件一般是二分类变量,如果扩大ROC分析的应用条件至三分类或者更多分类变量,则ROC曲线可能呈现出一个球面的形状,绘制起来非常困难,即便绘制出来也无法直观的去比较两个预测模型的AUC,更不好解释其临床意义,而NRI却可以很好的解决这些问题。NRI是如何解决这些问题的呢?
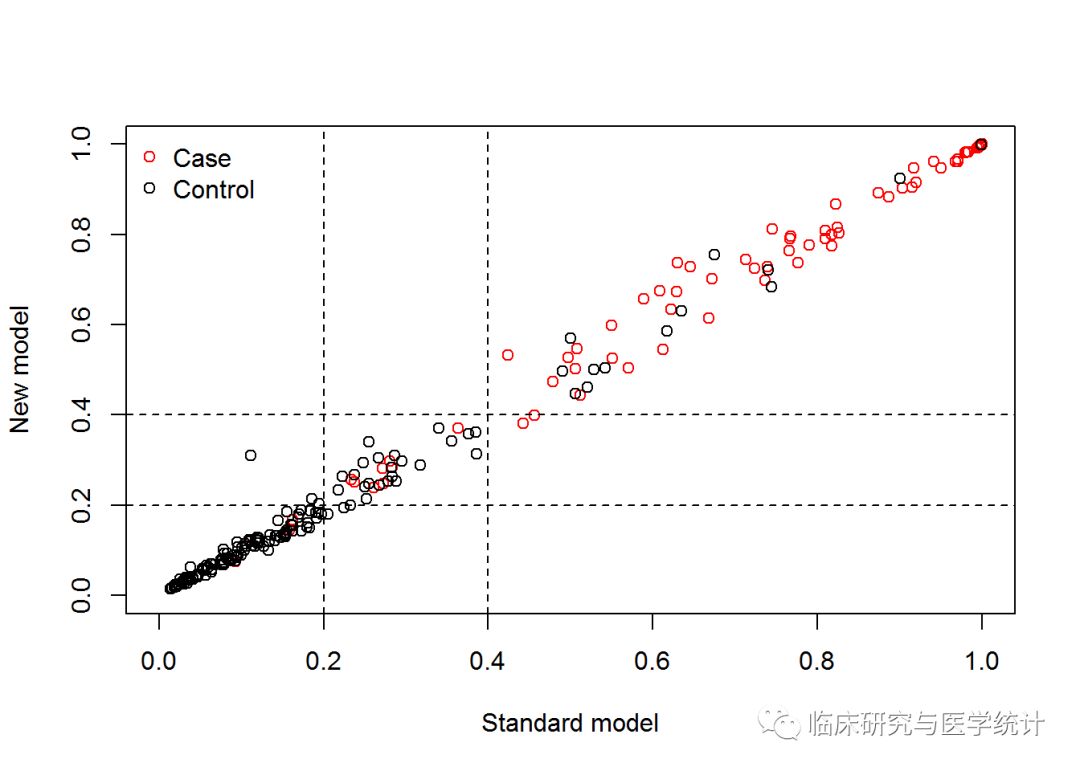
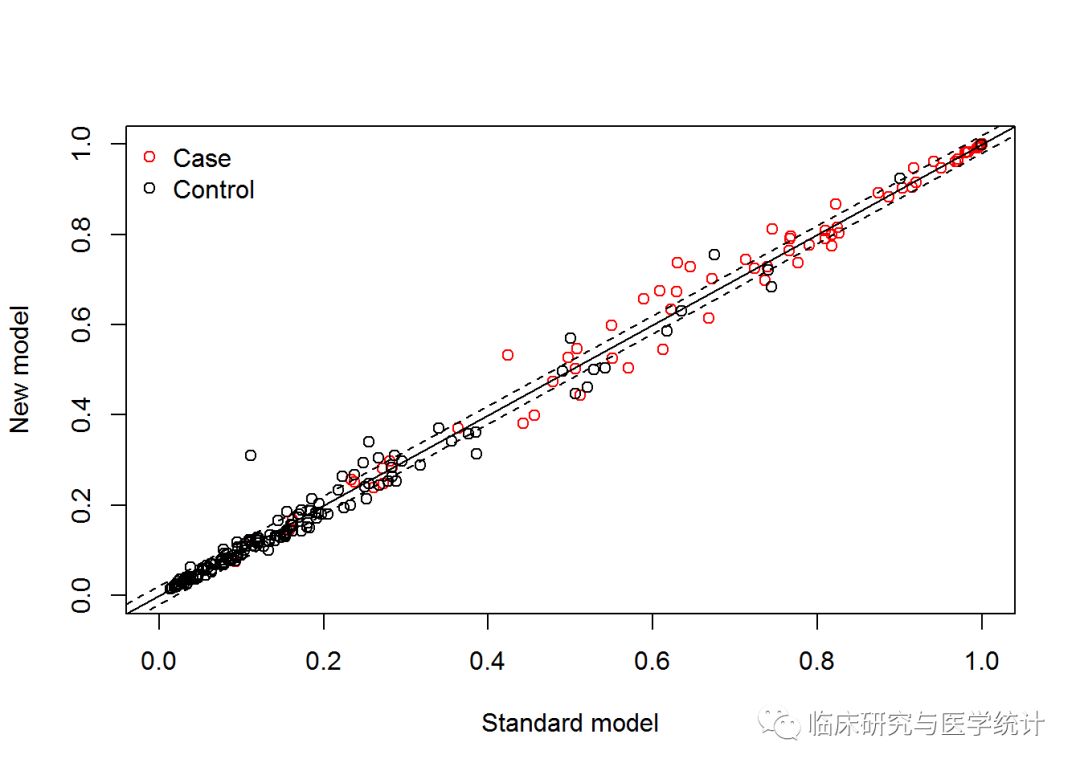
以发表在Stat Med杂志上这篇有关分类NRI计算方法学文章为例[2],研究者以著名的Framingham HeartStudy为基础,比较了在经典的模型中加入高密度脂蛋白HDL-C指标后,新模型对于研究对象未来10年冠心病发病风险预测能力的改善情况。研究人员首先比较了新、旧模型的ROC曲线,结果显示新、旧模型AUC分别为0.774和0.762,加入HDL-C后新预测模型AUC增加了0.012,差异无统计学显著性(P=0.092),提示新模型并无显著改善,如图2.所示。随后,研究人员又进一步将研究对象未来10年发生冠心病事件的风险概率,按照 <6%, 6-20%, >20%分为低、中、高三组,原文中的表格如图3.所示,并计算了NRI=12.1%,Z=3.616,P<0.001,具有统计学显著性,提示在加入了新的生物标志物后,新模型的预测能力有所改善,正确分类的比例提高了12.1%。
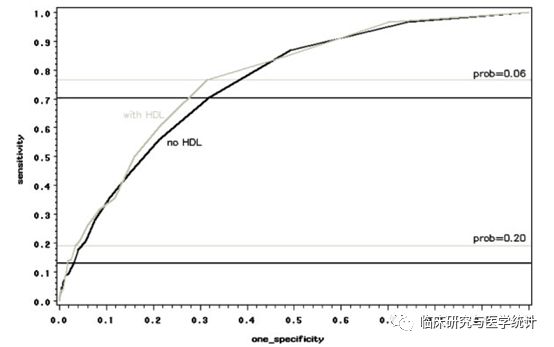
图2.新、旧模型的ROC曲线比较

图3.原文中截取的重分类表格
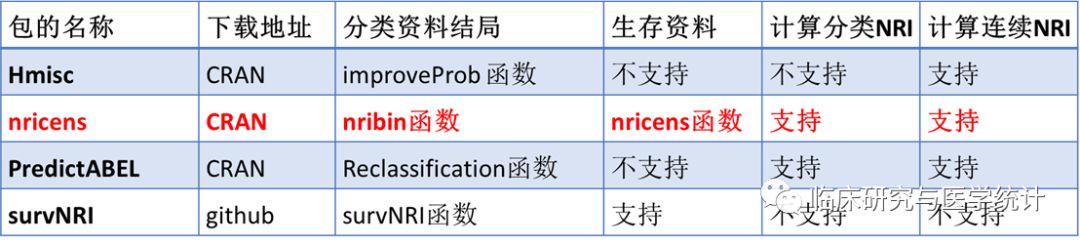
以上原理部分讲完了,下面讲解如何通过R软件计算NRI。这里要分分情况, 1.如果只是单纯计算一个新二分类诊断指标较旧指标诊断能力提高多少,可参阅上述计算公式,网上也有大神自编了R语言的计算函数来计算此类NRI; 2.基于Logistic回归构建的两个预测模型NRI计算; 3.基于Cox回归构建的两预测模型的NRI计算[3]。关于R中NRI的计算方法大家可参阅下表3.,我们重点介绍基于nricens包计算NRI[4-6],建议有关NRI计算首选此包。
表3. R中可计算NRI的包
3. 案例演示
(1)二分类结局
示例数据来自于survival包里自带的一份梅奥诊所的数据,记录了418位患者的临床指标与原发性胆汁性肝硬化(PBC)的关系。其中前312个患者来自于RCT研究,其他患者来自于队列研究。我们用前312例患者的数据来预测2000天时间点上是否发生死亡。此处需要说明的是原始数据是一个生存数据,我们重新定义一个二分类的结局,死亡or 存活,不考虑时间因素。先载入这份数据,如图4.所示。这个表中的结局变量是status,0 = 截尾(删失),1=接受肝移植,2=死亡。胆我们的研究目的“死亡与否”是个二分类变量,所以要做变量变换。再看time一栏,有的不够2000天,这些样本要么是没到2000天就死亡了,要么是删失了。我们要删掉2000天内删失的数据。其他关于数据中各变量的具体含义可用命令:? pbc查看。
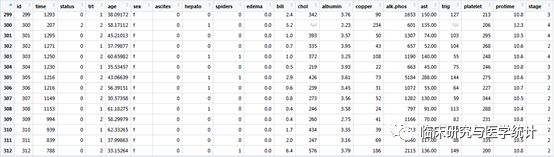 图4. 数据结构
R语言代码及结果解读
library(nricens)
## Loading required package: survival
dat= pbc[1:312,]
dat$sex= ifelse(dat$sex=='f', 1, 0)
删除时间小于2000天的截尾数据。“[ ]”表示筛选条件,|表示“或”,&为“和”。所以条件句就是dat中的time一列大于2000的保留,或小于2000但同时状态为死亡的也保留。最后一个 “,” 别忘记了,其在条件句的前面表示对列进行选择,在其后表示选择行,此处对行进行筛选。
dat= dat[ dat$time > 2000 | (dat$time < 2000 & dat$status == 2), ]
定义结局事件当time<2000,且status为2(死亡)时,记为1,否则为0。
event= ifelse(dat$time < 2000 & dat$status == 2, 1, 0)
构建一个dat数据集的子集含有变量:age,bili, albumin,并设为矩阵结构
z.std= as.matrix(subset(dat, select = c(age, bili, albumin)))
构建一个dat数据集的子集含有变量:age,bili, albumin, protime,并设为矩阵结构
z.new= as.matrix(subset(dat, select = c(age, bili, albumin, protime)))
分别拟合两个Logistics回归模型,mstd和mnew,后者比前者多了一个变量protime。x=TRUE是将来用nricens包计算时要求用到的,表示输出结果中是否包含所用到的数据表。
mstd= glm(event ~ ., binomial(logit), data.frame(event, z.std), x=TRUE)
mnew= glm(event ~ ., binomial(logit), data.frame(event, z.new), x=TRUE)
predicted risk,分别计算两个模型的预测风险
p.std= mstd$fitted.values
p.new= mnew$fitted.values
以上Logistic回归模型拟合完毕。
Calculation of risk category NRI using (‘mdl.std’, ‘mdl.std’).
nribin(mdl.std= mstd, mdl.new = mnew, cut = c(0.2, 0.4),
       niter = 1000, updown = 'category')
## UP and DOWN calculation:
##   #of total, case, and control subjects at t0:  232 88 144
##   Reclassification Table for all subjects:
##         New
## Standard < 0.2 < 0.4 >= 0.4
##   < 0.2    110     3      0
##   < 0.4      3    30      0
##   >= 0.4     0     2     84
##   Reclassification Table for case:
##         New
## Standard < 0.2 < 0.4 >= 0.4
##   < 0.2      7     0      0
##   < 0.4      0     8      0
##   >= 0.4     0     2     71
##   Reclassification Table for control:
##         New
## Standard < 0.2 < 0.4 >= 0.4
##   < 0.2    103     3      0
##   < 0.4      3    22      0
##   >= 0.4     0     0     13
## NRI estimation:
## Point estimates:
##                  Estimate
## NRI           -0.02272727
## NRI+          -0.02272727
## NRI-           0.00000000
## Pr(Up|Case)    0.00000000
## Pr(Down|Case)  0.02272727
## Pr(Down|Ctrl)  0.02083333
## Pr(Up|Ctrl)    0.02083333
## Now in bootstrap..
## Warning: glm.fit: fitted probabilities numerically 0 or 1 occurred
...

## Point & Interval estimates:

##                  Estimate  Std.Error       Lower      Upper
## NRI           -0.02272727 0.03200922 -0.05754196 0.08025656
## NRI+          -0.02272727 0.02078882 -0.05390875 0.03948052
## NRI-           0.00000000 0.02715176 -0.03558764 0.06993007
## Pr(Up|Case)    0.00000000 0.01611024  0.00000000 0.05805527
## Pr(Down|Case)  0.02272727 0.01969604  0.00000000 0.06803036
## Pr(Down|Ctrl)  0.02083333 0.03304244  0.00000000 0.11268164
## Pr(Up|Ctrl)    0.02083333 0.02306850  0.00000000 0.08178552
Calculation of risk difference NRI using (‘event’, ‘z.std’, ‘z.std’).
nribin(event= event, z.std = z.std, z.new = z.new, cut = c(0.2, 0.4),
       niter = 1000, updown = 'category')
## STANDARD prediction model:
##                Estimate Std. Error    z value     Pr(>|z|)
## (Intercept)  0.98927136 2.20809035  0.4480212 6.541379e-01
## age          0.07128234 0.01988079  3.5854876 3.364490e-04
## bili         0.61686651 0.10992947  5.6114755 2.006087e-08
## albumin     -1.95859156 0.53031693 -3.6932473 2.214085e-04
## NEW prediction model:
##                Estimate Std. Error    z value     Pr(>|z|)
## (Intercept) -1.16682234 2.92204889 -0.3993165 6.896600e-01
## age          0.06659224 0.02032242  3.2767864 1.049958e-03
## bili         0.59995139 0.11022521  5.4429600 5.240243e-08
## albumin     -1.88620553 0.53144647 -3.5491919 3.864153e-04
## protime      0.20127560 0.18388726  1.0945598 2.737095e-01
## UP and DOWN calculation:
##   #of total, case, and control subjects at t0:  232 88 144
##   Reclassification Table for all subjects:

##         New
## Standard < 0.2 < 0.4 >= 0.4
##   < 0.2    110     3      0
##   < 0.4      3    30      0
##   >= 0.4     0     2     84
##   Reclassification Table for case:
##         New
## Standard < 0.2 < 0.4 >= 0.4
##   < 0.2      7     0      0
##   < 0.4      0     8      0
##   >= 0.4     0     2     71
##   Reclassification Table for control:
##         New
## Standard < 0.2 < 0.4 >= 0.4
##   < 0.2    103     3      0
##   < 0.4      3    22      0
##   >= 0.4     0     0     13
## NRI estimation:
## Point estimates:
##                  Estimate
## NRI           -0.02272727
## NRI+          -0.02272727
## NRI-           0.00000000
## Pr(Up|Case)    0.00000000
## Pr(Down|Case)  0.02272727
## Pr(Down|Ctrl)  0.02083333
## Pr(Up|Ctrl)    0.02083333
## Now in bootstrap..
## Warning: glm.fit: fitted probabilities numerically 0 or 1 occurred
...

## Point & Interval estimates:

##                  Estimate  Std.Error       Lower      Upper
## NRI           -0.02272727 0.03335882 -0.05495020 0.08280423
## NRI+          -0.02272727 0.02241746 -0.05263158 0.04371715
## NRI-           0.00000000 0.02655613 -0.02963613 0.07719393
## Pr(Up|Case)    0.00000000 0.01834530  0.00000000 0.06472560
## Pr(Down|Case)  0.02272727 0.02027486  0.00000000 0.06711712
## Pr(Down|Ctrl)  0.02083333 0.03326849  0.00000000 0.11985915
## Pr(Up|Ctrl)    0.02083333 0.02091468  0.00000000 0.07547277
Calculation of risk difference NRI using (‘event’, ‘p.std’, ‘p.std’).
nribin(event= event, p.std = p.std, p.new = p.new, cut = c(0.2, 0.4),
       niter = 1000, updown = 'category')
## UP and DOWN calculation:
##   #of total, case, and control subjects at t0:  232 88 144
##   Reclassification Table for all subjects:
##         New
## Standard < 0.2 < 0.4 >= 0.4
##   < 0.2    110     3      0
##   < 0.4      3    30      0
##   >= 0.4     0     2     84
##   Reclassification Table for case:
##         New
## Standard < 0.2 < 0.4 >= 0.4
##   < 0.2      7     0      0
##   < 0.4      0     8      0
##   >= 0.4     0     2     71
##   Reclassification Table for control:
##         New
## Standard < 0.2 < 0.4 >= 0.4
##   < 0.2    103     3      0
##   < 0.4      3    22      0
##   >= 0.4     0     0     13
## NRI estimation:
## Point estimates:
##                  Estimate
## NRI           -0.02272727
## NRI+          -0.02272727
## NRI-           0.00000000
## Pr(Up|Case)    0.00000000
## Pr(Down|Case)  0.02272727
## Pr(Down|Ctrl)  0.02083333
## Pr(Up|Ctrl)    0.02083333
## Now in bootstrap..
## Point & Interval estimates:
##                  Estimate  Std.Error       Lower      Upper
## NRI           -0.02272727 0.02369581 -0.07554472 0.01888066
## NRI+          -0.02272727 0.01593310 -0.05952381 0.00000000
## NRI-           0.00000000 0.01742103 -0.03533613 0.03448276
## Pr(Up|Case)    0.00000000 0.00000000  0.00000000 0.00000000
## Pr(Down|Case)  0.02272727 0.01593310  0.00000000 0.05952381
## Pr(Down|Ctrl)  0.02083333 0.01140524  0.00000000 0.04433371
## Pr(Up|Ctrl)    0.02083333 0.01268630  0.00000000 0.04895105
Calculation of risk difference NRI using (‘mdl.std’, ‘mdl.std’).
nribin(mdl.std= mstd, mdl.new = mnew, cut = 0.02, niter = 0,
       updown = 'diff')
## UP and DOWN calculation:
##   #of total, case, and control subjects at t0:  232 88 144
##   #of subjects with 'p.new - p.std > cut' for all, case, control: 34 17 17
##   #of subjects with 'p.std - p.new < cut' for all, case, control: 36 13 23
## NRI estimation:
## Point estimates:
##                 Estimate
## NRI           0.08712121
## NRI+          0.04545455
## NRI-          0.04166667
## Pr(Up|Case)   0.19318182
## Pr(Down|Case) 0.14772727
## Pr(Down|Ctrl) 0.15972222
## Pr(Up|Ctrl)   0.11805556
Calculation of risk difference NRI using (‘event’, ‘z.std’, ‘z.std’).
nribin(event= event, z.std = z.std, z.new = z.new, cut = 0.02,
       niter = 1000, updown = 'diff')
## STANDARD prediction model:
##                Estimate Std. Error    z value     Pr(>|z|)
## (Intercept)  0.98927136 2.20809035  0.4480212 6.541379e-01
## age          0.07128234 0.01988079  3.5854876 3.364490e-04
## bili         0.61686651 0.10992947  5.6114755 2.006087e-08
## albumin     -1.95859156 0.53031693 -3.6932473 2.214085e-04
## NEW prediction model:
##                Estimate Std. Error    z value     Pr(>|z|)
## (Intercept) -1.16682234 2.92204889 -0.3993165 6.896600e-01
## age          0.06659224 0.02032242  3.2767864 1.049958e-03
## bili         0.59995139 0.11022521  5.4429600 5.240243e-08
## albumin     -1.88620553 0.53144647 -3.5491919 3.864153e-04
## protime      0.20127560 0.18388726  1.0945598 2.737095e-01
## UP and DOWN calculation:
##   #of total, case, and control subjects at t0:  232 88 144
##   #of subjects with 'p.new - p.std > cut' for all, case, control: 34 17 17
##   #of subjects with 'p.std - p.new < cut' for all, case, control: 36 13 23
## NRI estimation:
## Point estimates:
##                 Estimate
## NRI           0.08712121
## NRI+          0.04545455
## NRI-          0.04166667
## Pr(Up|Case)   0.19318182
## Pr(Down|Case) 0.14772727
## Pr(Down|Ctrl) 0.15972222
## Pr(Up|Ctrl)   0.11805556
## Now in bootstrap..
## Warning: glm.fit: fitted probabilities numerically 0 or 1 occurred
...

## Point & Interval estimates:

##                 Estimate  Std.Error       Lower     Upper
## NRI           0.08712121 0.10703150 -0.04115056 0.3484545
## NRI+          0.04545455 0.05032784 -0.03636497 0.1618551
## NRI-          0.04166667 0.07339238 -0.03496674 0.2238284
## Pr(Up|Case)   0.19318182 0.10057879  0.00000000 0.3575188
## Pr(Down|Case) 0.14772727 0.07783491  0.00000000 0.2806933
## Pr(Down|Ctrl) 0.15972222 0.12870698  0.00000000 0.4334576
## Pr(Up|Ctrl)   0.11805556 0.06670991  0.00000000 0.2439938
Calculation of risk difference NRI using (‘event’, ‘p.std’, ‘p.std’).
nribin(event= event, p.std = p.std, p.new = p.new, cut = 0.02,
       niter = 1000, updown = 'diff')
## UP and DOWN calculation:
##   #of total, case, and control subjects at t0:  232 88 144
##   #of subjects with 'p.new - p.std > cut' for all, case, control: 34 17 17
##   #of subjects with 'p.std - p.new < cut' for all, case, control: 36 13 23
## NRI estimation:
## Point estimates:
##                 Estimate
## NRI           0.08712121
## NRI+          0.04545455
## NRI-          0.04166667
## Pr(Up|Case)   0.19318182
## Pr(Down|Case) 0.14772727
## Pr(Down|Ctrl) 0.15972222
## Pr(Up|Ctrl)   0.11805556
## Now in bootstrap..
## Point & Interval estimates:

##                 Estimate  Std.Error       Lower     Upper
## NRI           0.08712121 0.07891890 -0.07363236 0.2313484
## NRI+          0.04545455 0.06423593 -0.07965871 0.1704545
## NRI-          0.04166667 0.04352676 -0.04697987 0.1202837
## Pr(Up|Case)   0.19318182 0.04258777  0.11827957 0.2795349
## Pr(Down|Case) 0.14772727 0.03909344  0.07473404 0.2253521
## Pr(Down|Ctrl) 0.15972222 0.03047740  0.10067114 0.2214286
## Pr(Up|Ctrl)   0.11805556 0.02716925  0.06569343 0.1760563
比较新旧两个模型准确性。cut是判断风险高低的临界值,现在我们写了2个,0~20%为低风险,20%~40%为中风险,40%~100%为高风险。根据实际情况确定风险划分的界值,相当于把一个连续的风险概率划分为有序分类变量。updown为定义一个样本的风险是否变动的方式,category是指分类值,即低、中、高风险;另有一种diff,为连续值。选diff时,cut就设1个值,比如0.02,即认为当预测的风险在新旧模型中相差2%时,即被认为是重新分类了。niter为迭代次数,即boostrap重抽样次数,计算NRI的标准误需要重抽样方法计算,如设置为0即表示不计算NRI的标准误,一般迭代次数设置为1000次,如果设置过大对于计算机运算速度要求较高,可能计算要花费很长时间,当然设置越大精确度越高。检验水准alpha一般设为0.05。主要结果截取如下:
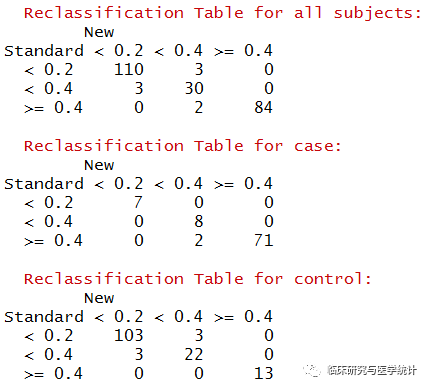
图5. 在所有结局、阳性结局、阴性结局中重分类的表格(case在预测模型中应该理解为结局发生,control理解为结局未发生)
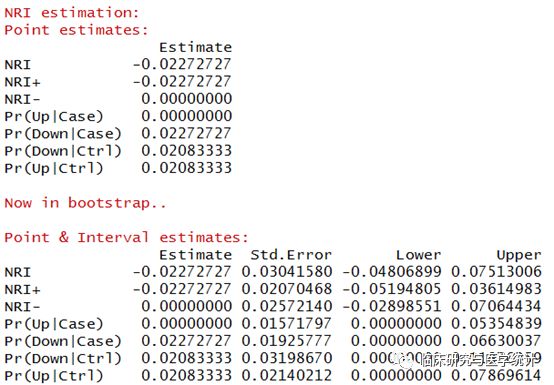
图6. NRI点估计计算结果及重抽样后估计的标准误与可信区间。新模型较旧模型重分类正确的比例提高-2.2727%,换句话说增加一个预测变量的新模型预测的准确度降低了,新模型比旧模型差。
(2)生存资料结局
案例数据同上。生存资料的NRI与分类结局的NRI差别在于前者需要构建Cox回归模型,所以我们首先构建新旧Cox回归模型,计算这两个模型的NRI.
R语言代码及结果解读
here consider pbc dataset in survival package as an example
library(nricens)
dat= pbc[1:312,]
dat$sex= ifelse(dat$sex=='f', 1, 0)
predciting the event of ‘death’
time= dat$time
event= ifelse(dat$status==2, 1, 0)
standard prediction model: age, bilirubin, and albumin
z.std= as.matrix(subset(dat, select = c(age, bili, albumin)))
new prediction model: age, bilirubin, albumin, and protime
z.new= as.matrix(subset(dat, select = c(age, bili, albumin, protime)))
coxph fit构建Cox生存函数模型
mstd= coxph(Surv(time,event) ~ ., data.frame(time,event,z.std), x=TRUE)
mnew= coxph(Surv(time,event) ~ ., data.frame(time,event,z.new), x=TRUE)
predicted risk at t0=2000,2000天时间点的死亡风险
p.std= get.risk.coxph(mstd, t0=2000)
p.new= get.risk.coxph(mnew, t0=2000)
以上新、旧Cox回归模型构建完成,并计算了2000天的新、旧模型计算的死亡风险
Calculation of risk category NRI
by the KM estimator using (‘mdl.std’, ‘mdl.std’).
nricens(mdl.std= mstd, mdl.new = mnew, t0 = 2000, cut = c(0.2, 0.4),
        niter = 1000, updown = 'category')
## UP and DOWN calculation:
##   #of total, case, and control subjects at t0:  312 88 144
##   Reclassification Table for all subjects:
##         New
## Standard < 0.2 < 0.4 >= 0.4
##   < 0.2    139     7      1
##   < 0.4     17    72      6
##   >= 0.4     0     5     65
##
##   Reclassification Table for case:
##         New
## Standard < 0.2 < 0.4 >= 0.4
##   < 0.2      9     2      0
##   < 0.4      1    21      4
##   >= 0.4     0     0     51
##   Reclassification Table for control:
##         New
## Standard < 0.2 < 0.4 >= 0.4
##   < 0.2     92     4      1
##   < 0.4      9    29      2
##   >= 0.4     0     3      4
## NRI estimation by KM estimator:
## Point estimates:
##                 Estimate
## NRI           0.11028068
## NRI+          0.05123381
## NRI-          0.05904686
## Pr(Up|Case)   0.06348538
## Pr(Down|Case) 0.01225156
## Pr(Down|Ctrl) 0.09583016
## Pr(Up|Ctrl)   0.03678329
## Now in bootstrap..
## Point & Interval estimates:

##                 Estimate       Lower      Upper
## NRI           0.11028068 -0.03194805 0.21128035
## NRI+          0.05123381 -0.06016772 0.12689397
## NRI-          0.05904686 -0.01259183 0.14479307
## Pr(Up|Case)   0.06348538  0.01097353 0.18010236
## Pr(Down|Case) 0.01225156  0.00000000 0.14140739
## Pr(Down|Ctrl) 0.09583016  0.02548172 0.20380318
## Pr(Up|Ctrl)   0.03678329  0.01337693 0.09614351
by the KM estimator using (‘time’, ‘event’, ‘z.std’, ‘z.std’).
nricens(time= time, event = event, z.std = z.std, z.new = z.new,
        t0 = 2000, cut = c(0.2, 0.4), niter = 1000,updown = 'category')
## STANDARD prediction model (Cox model):
##                coef exp(coef)    se(coef)         z     Pr(>|z|)
## age      0.03726683 1.0379699 0.009048925  4.118371 3.815600e-05
## bili     0.13531179 1.1448937 0.013711323  9.868617 5.694436e-23
## albumin -1.44611854 0.2354825 0.221997986 -6.514107 7.312356e-11
## NEW prediction model (Cox model):
##                coef exp(coef)    se(coef)         z     Pr(>|z|)
## age      0.03362675 1.0341985 0.009214173  3.649460 2.627925e-04
## bili     0.12517886 1.1333511 0.014406820  8.688861 3.660902e-18
## albumin -1.39395237 0.2480928 0.217046959 -6.422354 1.341831e-10
## protime  0.28602917 1.3311313 0.070536400  4.055058 5.012193e-05
## UP and DOWN calculation:
##   #of total, case, and control subjects at t0:  312 88 144
##   Reclassification Table for all subjects:
##         New
## Standard < 0.2 < 0.4 >= 0.4
##   < 0.2    139     7      1
##   < 0.4     17    72      6
##   >= 0.4     0     5     65
##   Reclassification Table for case:
##         New
## Standard < 0.2 < 0.4 >= 0.4
##   < 0.2      9     2      0
##   < 0.4      1    21      4
##   >= 0.4     0     0     51
##   Reclassification Table for control:
##         New
## Standard < 0.2 < 0.4 >= 0.4
##   < 0.2     92     4      1
##   < 0.4      9    29      2
##   >= 0.4     0     3      4
##
## NRI estimation by KM estimator:
## Point estimates:
##                 Estimate
## NRI           0.11028068
## NRI+          0.05123381
## NRI-          0.05904686
## Pr(Up|Case)   0.06348538
## Pr(Down|Case) 0.01225156
## Pr(Down|Ctrl) 0.09583016
## Pr(Up|Ctrl)   0.03678329
## Now in bootstrap..
## Point & Interval estimates:

##                 Estimate       Lower      Upper
## NRI           0.11028068 -0.03554127 0.21651743
## NRI+          0.05123381 -0.06913789 0.12370518
## NRI-          0.05904686 -0.01220950 0.13696724
## Pr(Up|Case)   0.06348538  0.01851364 0.19150211
## Pr(Down|Case) 0.01225156  0.00000000 0.14501826
## Pr(Down|Ctrl) 0.09583016  0.02368265 0.20899670
## Pr(Up|Ctrl)   0.03678329  0.01331195 0.09664003
by the KM estimator using (‘time’,‘event’,‘p.std’,‘p.std’).
nricens(time= time, event = event, p.std = p.std, p.new = p.new,
        t0 = 2000, cut = c(0.2, 0.4), niter = 1000,updown = 'category')
## UP and DOWN calculation:
##   #of total, case, and control subjects at t0:  312 88 144
##   Reclassification Table for all subjects:
##         New
## Standard < 0.2 < 0.4 >= 0.4
##   < 0.2    139     7      1
##   < 0.4     17    72      6
##   >= 0.4     0     5     65
##   Reclassification Table for case:
##         New
## Standard < 0.2 < 0.4 >= 0.4
##   < 0.2      9     2      0
##   < 0.4      1    21      4
##   >= 0.4     0     0     51
##   Reclassification Table for control:
##         New
## Standard < 0.2 < 0.4 >= 0.4
##   < 0.2     92     4      1
##   < 0.4      9    29      2
##   >= 0.4     0     3      4
## NRI estimation by KM estimator:
## Point estimates:
##                 Estimate
## NRI           0.11028068
## NRI+          0.05123381
## NRI-          0.05904686
## Pr(Up|Case)   0.06348538
## Pr(Down|Case) 0.01225156
## Pr(Down|Ctrl) 0.09583016
## Pr(Up|Ctrl)   0.03678329
## Now in bootstrap..
## Point & Interval estimates:
##                 Estimate        Lower      Upper
## NRI           0.11028068  0.038654934 0.18500252
## NRI+          0.05123381 -0.002290732 0.10941601
## NRI-          0.05904686  0.009447491 0.11101409
## Pr(Up|Case)   0.06348538  0.019782577 0.11565000
## Pr(Down|Case) 0.01225156  0.000000000 0.04029557
## Pr(Down|Ctrl) 0.09583016  0.057142752 0.14102524
## Pr(Up|Ctrl)   0.03678329  0.013629602 0.06516565
Calculation of risk difference NRI by the KM estimator
nricens(mdl.std= mstd, mdl.new = mnew, t0 = 2000, updown = 'diff',
        cut = 0.05, niter = 1000)
### UP and DOWN calculation:
##   #of total, case, and control subjects at t0:  312 88 144
##   #of subjects with 'p.new - p.std > cut' for all, case, control: 34 21 11
##   #of subjects with 'p.std - p.new < cut' for all, case, control: 40 12 8
## NRI estimation by KM estimator:
## Point estimates:
##                 Estimate
## NRI           0.10070960
## NRI+          0.05097223
## NRI-          0.04973737
## Pr(Up|Case)   0.22431499
## Pr(Down|Case) 0.17334277
## Pr(Down|Ctrl) 0.10859064
## Pr(Up|Ctrl)   0.05885327
## Now in bootstrap..
## Point & Interval estimates:
##                 Estimate       Lower     Upper
## NRI           0.10070960 -0.04228013 0.3810405
## NRI+          0.05097223 -0.06194892 0.2221666
## NRI-          0.04973737 -0.02729504 0.2291545
## Pr(Up|Case)   0.22431499  0.07883984 0.3822543
## Pr(Down|Case) 0.17334277  0.01019444 0.2965650
## Pr(Down|Ctrl) 0.10859064  0.00000000 0.3517454
## Pr(Up|Ctrl)   0.05885327  0.02304369 0.1342790
Calculation of risk difference NRI by the IPW estimator
nricens(mdl.std= mstd, mdl.new = mnew, t0 = 2000, updown = 'diff',
        cut = 0.05, point.method = 'ipw', niter= 1000)
## UP and DOWN calculation:
##   #of total, case, and control subjects at t0:  312 88 144
##   #of subjects with 'p.new - p.std > cut' for all, case, control: 34 21 11
##   #of subjects with 'p.std - p.new < cut' for all, case, control: 40 12 8
## NRI estimation by IPW estimator:
## Point estimates:
##                  Estimate
## NRI            0.06361038
## NRI+           0.08444371
## NRI-          -0.02083333
## Pr(Up|Case)    0.22905909
## Pr(Down|Case)  0.14461537
## Pr(Down|Ctrl)  0.05555556
## Pr(Up|Ctrl)    0.07638889
## Now in bootstrap..
## Point & Interval estimates:

##                  Estimate       Lower     Upper
## NRI            0.06361038 -0.05790451 0.3006199
## NRI+           0.08444371 -0.02002052 0.2351667
## NRI-          -0.02083333 -0.06968726 0.1159481
## Pr(Up|Case)    0.22905909  0.06809346 0.3935156
## Pr(Down|Case)  0.14461537  0.00000000 0.2630693
## Pr(Down|Ctrl)  0.05555556  0.00000000 0.2452356
## Pr(Up|Ctrl)    0.07638889  0.03174891 0.1677636
参数解释同分类结局。
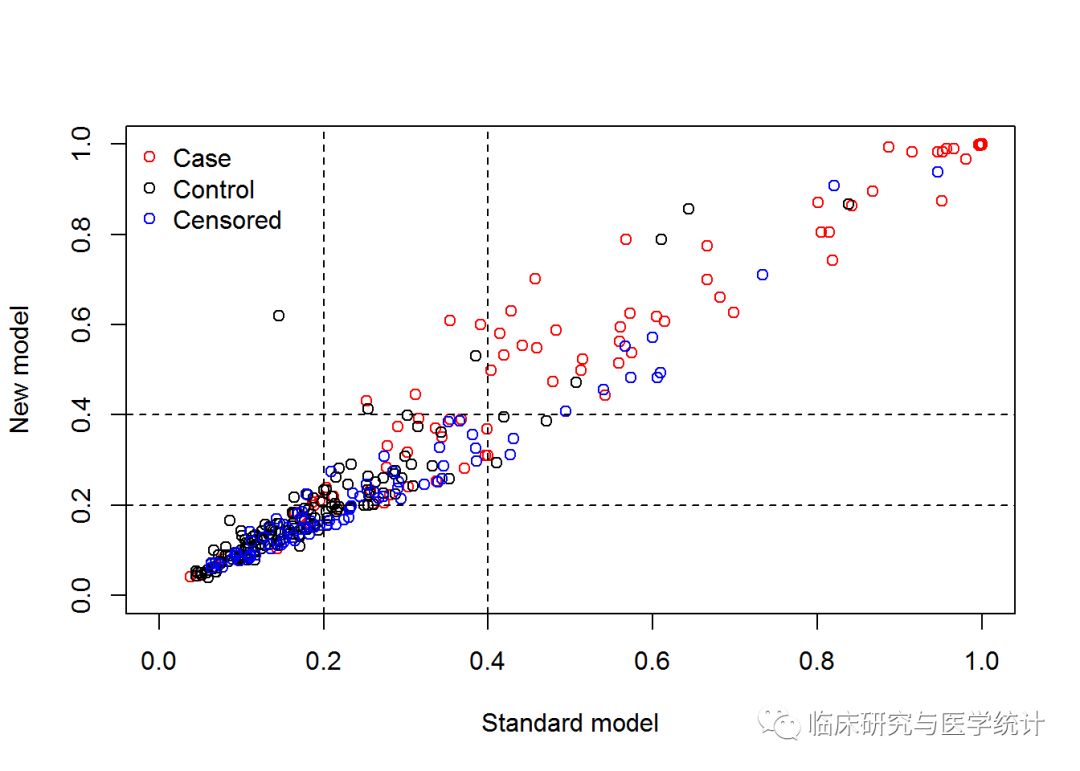
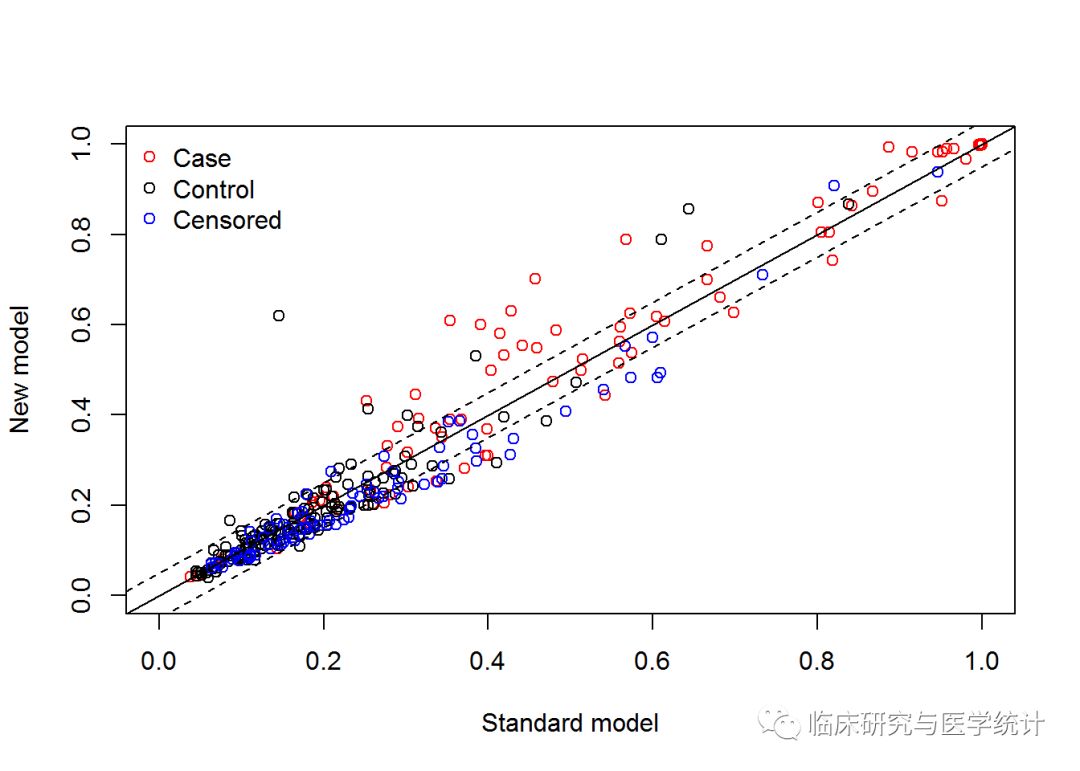
主要计算结果如下图7.与图8.所示:
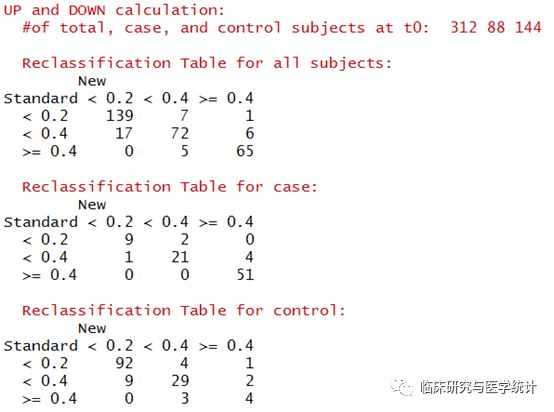
图7. 在所有结局、阳性结局、阴性结局中重分类的表格(case在Cox预测模型中应该理解为结局发生,control理解为结局未发生)
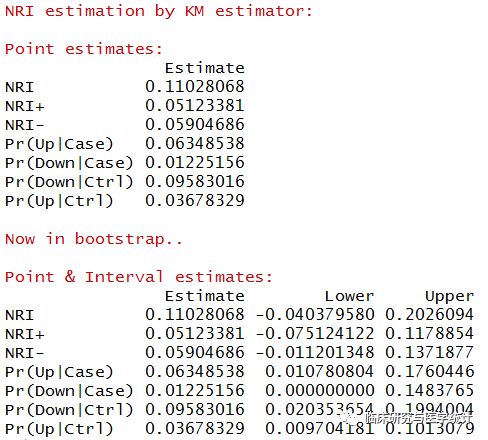
图8. NRI点估计的计算结果及重抽样后估计的可信区间。新模型较旧模型重分类正确的比例提高11.028%,换句话说增加一个预测变量的新模型预测的准确度比旧模型更好。
本章关于NRI的计算讲解完毕。下一章我们将介绍另外一个指标IDI(Integrated Discrimination Improvement,综合判别改善指数)的计算原理与计算方法,欢迎关注。
4. 参考文献
[1] Alba A C, Agoritsas T, Walsh M, et al.Discrimination and Calibration of Clinical Prediction Models: Users’ Guides tothe Medical Literature [J]. Jama, 2017, 318(14): 1377-84.
[2] Pencina M J, D’Agostino R B, Sr., D’AgostinoR B, Jr., et al. Evaluating the added predictive ability of a new marker: fromarea under the ROC curve to reclassification and beyond [J]. Statistics inmedicine, 2008, 27(2): 157-72; discussion 207-12.
[3] http://ncook.bwh.harvard.edu/r-code.html
[4] Pencina MJ, D’Agostino RB, Steyerberg EW. Extensions of net reclassificationimprovement calculations to measure usefulness of new biomarkers. Statistics inMedicine 2011.
[5] Uno H, Tian L, Cai T, Kohane IS, Wei LJ. A unified inferenceprocedure for a class of measures to assess improvement in risk predictionsystems with survival data, Statistics in Medicine 2012.
[6] Hsu CH, Taylor JMG. A robust weighted Kaplan-Meier approach fordata with dependent censoring using linear combinations of prognosticcovariates, Statistics in Medicine 2010.