

凡是和数据无关的图形设置内容理论上都可以归 主题类 但考虑到一些内容(如 坐标轴 )的特殊性,可以允许例外的情况。主题的设置相当繁琐,很容易就占用了大量的作图时间,应尽量把这些东西简化,把注意力主要放在数据分析上。基于这种考虑,ggplot2主题设置的内容虽然相当多,本文仅在总体上作一简单介绍。
1 theme函数及其参数
让使用者在数据分析阶段能专注于数据而不是图形细节,这是数据可视化分析工具是否合格的标准之一。某些软件作出的初始图形简直惨不忍睹,不花时间修改字体、边距、底纹这些东西就恶心得没法继续分析数据。ggplot2做得还可以:即使不做任何设置,多数情况下作出的图形都还不错,不丑陋也不妖艳,不会分散用户的注意力。这得益于ggplot2的几个预设主题。
ggplot2的四个预设主题我们在前面已经预览过了,下面我们看看主题都包含了哪些东西。这很容易,把ggplot2默认主题的设置函数theme_bw()的代码拿出来看看就知道了:
library(ggplot2)
theme_gray  # 函数名不加括号,获得函数的代码
## function (base_size = 12, base_family = "")
## {
##     theme(line = element_line(colour = "black", size = 0.5, linetype = 1,
##         lineend = "butt"), rect = element_rect(fill = "white",
##         colour = "black", size = 0.5, linetype = 1), text = element_text(family = base_family,
##         face = "plain", colour = "black", size = base_size, hjust = 0.5,
##         vjust = 0.5, angle = 0, lineheight = 0.9), axis.text = element_text(size = rel(0.8),
##         colour = "grey50"), strip.text = element_text(size = rel(0.8)),
##         axis.line = element_blank(), axis.text.x = element_text(vjust = 1),
##         axis.text.y = element_text(hjust = 1), axis.ticks = element_line(colour = "grey50"),
##         axis.title.x = element_text(), axis.title.y = element_text(angle = 90),
##         axis.ticks.length = unit(0.15, "cm"), axis.ticks.margin = unit(0.1,
##             "cm"), legend.background = element_rect(colour = NA),
##         legend.margin = unit(0.2, "cm"), legend.key = element_rect(fill = "grey95",
##             colour = "white"), legend.key.size = unit(1.2, "lines"),
##         legend.key.height = NULL, legend.key.width = NULL, legend.text = element_text(size = rel(0.8)),
##         legend.text.align = NULL, legend.title = element_text(size = rel(0.8),
##             face = "bold", hjust = 0), legend.title.align = NULL,
##         legend.position = "right", legend.direction = NULL, legend.justification = "center",
##         legend.box = NULL, panel.background = element_rect(fill = "grey90",
##             colour = NA), panel.border = element_blank(), panel.grid.major = element_line(colour = "white"),
##         panel.grid.minor = element_line(colour = "grey95", size = 0.25),
##         panel.margin = unit(0.25, "lines"), strip.background = element_rect(fill = "grey80",
##             colour = NA), strip.text.x = element_text(), strip.text.y = element_text(angle = -90),
##         plot.background = element_rect(colour = "white"), plot.title = element_text(size = rel(1.2)),
##         plot.margin = unit(c(1, 1, 0.5, 0.5), "lines"), complete = TRUE)
## }
##
看穿了吧,没神秘感了。它无非是一个具有两个参数的函数:base_size和base_family。其主题部分直接应用了另外一个函数:theme。它就是ggplot2的主题设置函数。这个theme函数的产生看起来非常简单:
# 函数说明,非运行代码
theme(..., complete = FALSE)
但dotdotdot(···)参数却内涵丰富,它可以设置很多内容。
| 参数 | 设置内容 | 继承自 |
| line | 所有线属性 | |
| rect | 所有矩形区域属性 | |
| text | 所有文本相关属性 | |
| title | 所有标题属性 | |
| axis.title | 坐标轴标题 | text |
| axis.title.x | x轴属性 | axis.title |
| axis.title.y | y轴属性 | axis.title |
| axis.text | 坐标轴刻度标签属性 | text |
| axis.text.x | 属性和继承和前面类似,不再重复 | |
| axis.text.y | ||
| axis.ticks | 坐标轴刻度线 | line |
| axis.ticks.x | ||
| axis.ticks.y | ||
| axis.ticks.length | 刻度线长度 | |
| axis.ticks.margin | 刻度线和刻度标签之间的间距 | |
| axis.line | 坐标轴线 | line |
| axis.line.x | ||
| axis.line.y | ||
| legend.background | 图例背景 | rect |
| legend.margin | 图例边界 | |
| legend.key | 图例符号 | |
| legend.key.size | 图例符号大小 | |
| legend.key.height | 图例符号高度 | |
| legend.key.width | 图例符号宽度 | |
| legend.text | 图例文字标签 | |
| legend.text.align | 图例文字标签对齐方式 | 0为左齐,1为右齐 |
| legend.title | 图例标题 | text |
| legend.title.align | 图例标题对齐方式 | |
| legend.position | 图例位置 | left, right, bottom, top, 两数字向量 |
| legend.direction | 图例排列方向 | "horizontal" or "vertical" |
| legend.justification | 居中方式 | center或两数字向量 |
| legend.box | 多图例的排列方式 | "horizontal" or "vertical" |
| legend.box.just | 多图例居中方式 | |
| panel.background | 绘图区背景 | rect |
| panel.border | 绘图区边框 | rect |
| panel.margin | 分面绘图区之间的边距 | |
| panel.grid | 绘图区网格线 | line |
| panel.grid.major | 主网格线 | |
| panel.grid.minor | 次网格线 | |
| panel.grid.major.x | ||
| panel.grid.major.y | ||
| panel.grid.minor.x | ||
| panel.grid.minor.y | ||
| plot.background | 整个图形的背景 | |
| plot.title | 图形标题 | |
| plot.margin | 图形边距 | top, right, bottom, left |
| strip.background | 分面标签背景 | rect |
| strip.text | 分面标签文本 | text |
| strip.text.x | ||
| strip.text.y |
所有元素都在theme函数内使用element_line,element_rect,element_text和element_blank函数设置,使用方法参考这几个函数的参数说明即可,这里不再一一举例说明。
text, line, rect和title是最顶层的元素,理论上可以做全局设定,但当前版本ggplot2还没有实现,可以根据情况做一些调整:
x <- LETTERS[1:10]; y <- abs(rnorm(10))
(p <- qplot(x=x, y=y, color=x, fill=x, geom=c('line','point'), group=1) +
  labs(title='The figure title.', xlab='Factor', ylab='Value') +
  theme(text=element_text(color='red', size=16),
        line=element_line(color='blue'),
        rect=element_rect(fill='white')))
p + theme(panel.background=element_rect(fill='transparent', color='gray'),
          legend.key=element_rect(fill='transparent', color='transparent'),
          axis.text=element_text(color='red'))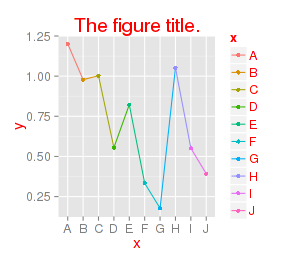
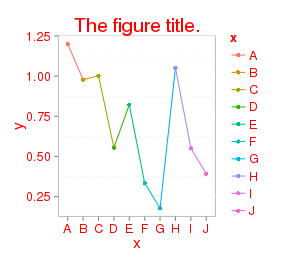
全局text和rect设置对部分元素有作用,line基本不起作用。
2 自定义主题
图形细节设置虽然繁琐,但是在R和ggplot2中可以相当简单。自己使用的或者杂志要求的图形外观一般都很固定,我们可以使用theme函数非常方便定义自己的图形主题:
##' A nice-looking ggplot2 theme: inward axis ticks, legend title excluded, and uniform background.
##' @title A nice-looking ggplot2 theme
##' @param ...
##' Parameters passed to theme_classic() function.
##' @param bg
##' Color string (default 'white') for user defined uniform background.
##' @return
##' ggplot2 theme object.
##' @example
##' library(ggplot2)
##' qplot(x=carat, y=price, color=cut, data=diamonds) + theme_zg()
##' @author ZG Zhao
##' @export
theme_zg <- function(..., bg='white'){
    require(grid)
    theme_classic(...) +
        theme(rect=element_rect(fill=bg),
              plot.margin=unit(rep(0.5,4), 'lines'),
              panel.background=element_rect(fill='transparent', color='black'),
              panel.border=element_rect(fill='transparent', color='transparent'),
              panel.grid=element_blank(),
              axis.title = element_text(color='black', vjust=0.1),
              axis.ticks.length = unit(-0.4,"lines"),
              axis.ticks = element_line(color='black'),
              axis.ticks.margin = unit(0.8,"lines"),
              legend.title=element_blank(),
              legend.key=element_rect(fill='transparent', color='transparent'))
}
自定义的主题可以编入自己的R语言包中,方便调用。如果觉得你的主题很有代表性,那就发给ggplot2的作者,让他在下一版本中加到ggplot2发行版中。比如上面上面函数加入ggplot2后就可以直接调用:
p <- qplot(x=x, y=y, color=x, fill=x, geom=c('line','point'), group=1) +
labs(title='The figure title.', xlab='Factor', ylab='Value')
p + theme_zg()
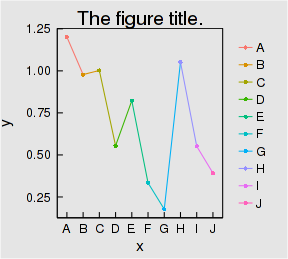
p + theme_zg(base_size=16, bg='gray90')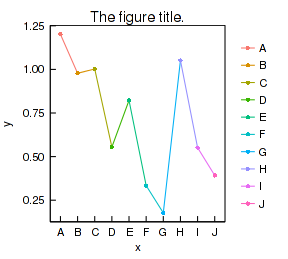
3 结束语
本系列博文到此结束。ggplot2还在完善过程中,一些新功能可能不断会实现,感谢H.W的努力。如果想比较透彻的学习,建议最好直接到Github把ggplot2项目克隆下来研究它的代码。本系列文章的例子基于ggplot2 0.93版本,如果发现一些代码运行不正确或效果图有变化,应该是版本不同了。文章后都有sessionInfo信息可参考。
4 SessionInfo
sessionInfo()
## R version 3.1.0 (2014-04-10)
## Platform: x86_64-pc-linux-gnu (64-bit)
##
## locale:
##  [1] LC_CTYPE=zh_CN.UTF-8       LC_NUMERIC=C
##  [3] LC_TIME=zh_CN.UTF-8        LC_COLLATE=zh_CN.UTF-8
##  [5] LC_MONETARY=zh_CN.UTF-8    LC_MESSAGES=zh_CN.UTF-8
##  [7] LC_PAPER=zh_CN.UTF-8       LC_NAME=C
##  [9] LC_ADDRESS=C               LC_TELEPHONE=C
## [11] LC_MEASUREMENT=zh_CN.UTF-8 LC_IDENTIFICATION=C
##
## attached base packages:
## [1] grid      tcltk     stats     graphics  grDevices utils     datasets
## [8] methods   base
##
## other attached packages:
## [1] ggplot2_0.9.3.1 zblog_0.1.0     knitr_1.5
##
## loaded via a namespace (and not attached):
##  [1] colorspace_1.2-4 digest_0.6.4     evaluate_0.5.3   formatR_0.10
##  [5] gtable_0.1.2     highr_0.3        labeling_0.2     MASS_7.3-31
##  [9] munsell_0.4.2    plyr_1.8.1       proto_0.3-10     Rcpp_0.11.1
## [13] reshape2_1.2.2   scales_0.2.4     stringr_0.6.2    tools_3.1.0
原文来自:http://blog.csdn.net/u014801157/article/details/24372531