

以下介绍引用自
表达谱芯片数据的基因功能富集分析
刘 明 王米渠 丁维俊 综述 毕 锋 审校
基因富集分析是生物信息学分析领域的一种分析方法。常见的基因富集分析是基因功能富集分析,这种方法可以对不同层次不同来源的数据进行整合,并在没有先验经验存在的情况下也能在表达谱整体层次上对上万条基因进行富集分析。
基因功能富集分析原理
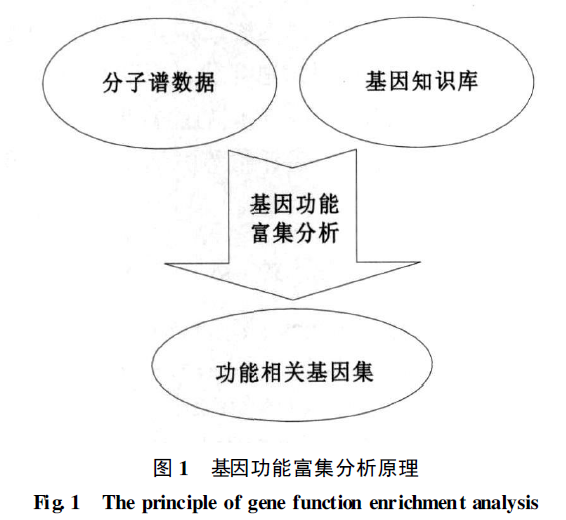
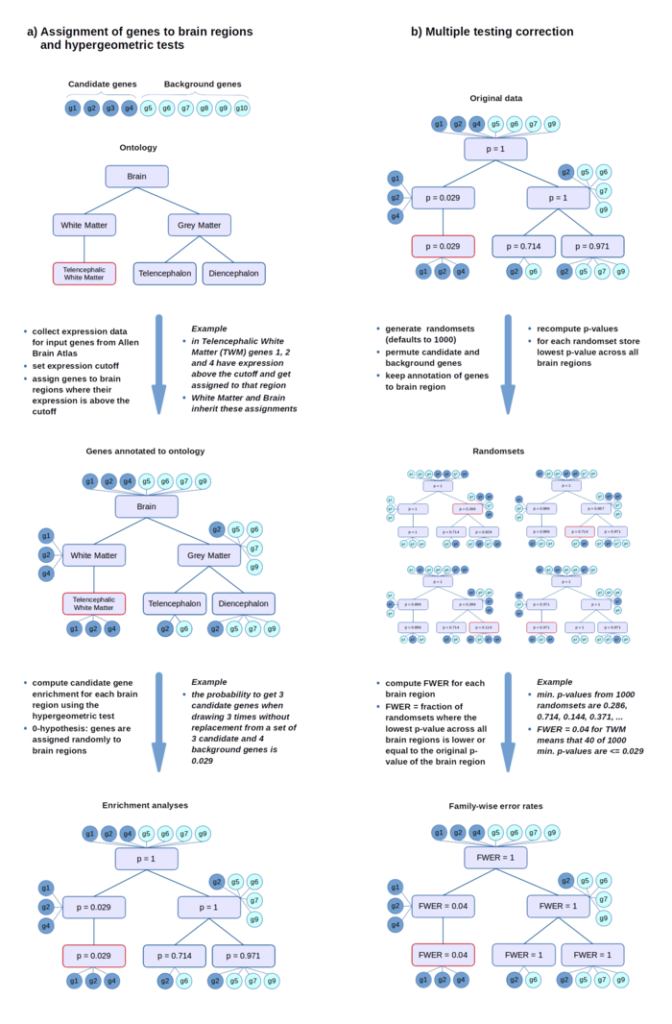
基因功能富集分析又称功能聚类分析, 主要借助于各种生物学信息数据库和分析工具进行统计分析, 挖掘在基因知识库中同分子谱数据具有显著相关性的功能类别, 统计原理是用超几何分布型来检验一组基因( 共表达或差异表达) 中某个功能类的显著性, 通过离散分布的显著性分析、富集度分析和假阳性分析,得出与实验目的有显著关联的、低假阳性率的及靶向性的基因功能类别, 该功能类别即是导致样本性状差异的最重要的功能差别, 而其所属基因是需进一步验证的重要目标基因, 其功能特征将阐明样本性状变化的内在生物学意义, 如图1所示。
分子谱数据可以通过多种方法获得:
- 过倍数法、Z 值法、t-检验及方差分析、贝叶斯分析等统计学方法获得的差异表达基因
- 或者是通过K-均值聚类( K-means cluster) 、分层聚类( hierarchical clustering, HC) 、自组织映射神经网络( self-organizing map, SOM) 等方法获得的各个独立的基因簇
基因知识库主要指:
- Gene Ontology 数据库( http://www.geneontology.org/)
- KEGG PATHWAY 数据库( http://www.genome.ad.jp/kegg/pathway.html)
- BioCarta 数据库( http://www.biocarta.com/ )
- TRANSFAC 数据库( http://www.gene-regulation.com/pub/databases.html) 等所包括的基因集
Note: 位于同一个信号通路、生物学过程、物质代谢通路或定位于染色体的邻近位点等的一群基因被称为一个基因集。
基因功能富集分析的相关软件
- MAPPFinde( http://www.genmapp.org/ )
- GSEA (http://www.broad.mit.edu/gsea/)
- ArrayXPath、Expander ( http://acgt.cs.tau.ac.il/expander/ )
- Gene Set Analysis ( http://www.stat.stanford.edu/~tibs/GSA/)
基因集富集分析( gene set enrichment analysis, GSEA)
GSEA 是2003年提出来的一种对表达谱芯片进行分析的方法, 并被编制成软件。它的主要目的就是确定预先定义的基因集( 具有相同或相似的功能, 或位于同一染色体相邻位点的一群基因) 在表达谱芯片结果中是否有显著性。
GSEA 分析过程分为5 步:
- 基因知识库的获得;
- 根据基因表达谱数据对所有基因进行排序
- 计算富集得分( enrichment score, ES)
- 估计显著性水平;
- 进行多重假设检验。
以下引用 基因表达谱富集分析方法研究进展 曹文君,李运明,陈长生
因集的定义
基因集的定义基于统一的先验生物学知识,如已发表的有关生物通道、基因共表达信息等。一个基因及是基因芯片上一组具有相同生物学功能或位于统一生物通道的基因。最常用于定义基因集的基因注释数据库有Gene Ontology (GO)、Kyoto Encyclopedia of Genes and Genomes orthology(KO)和ENTREZ。
1. GO功能注释
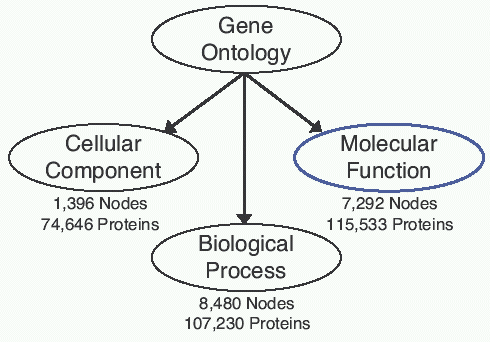
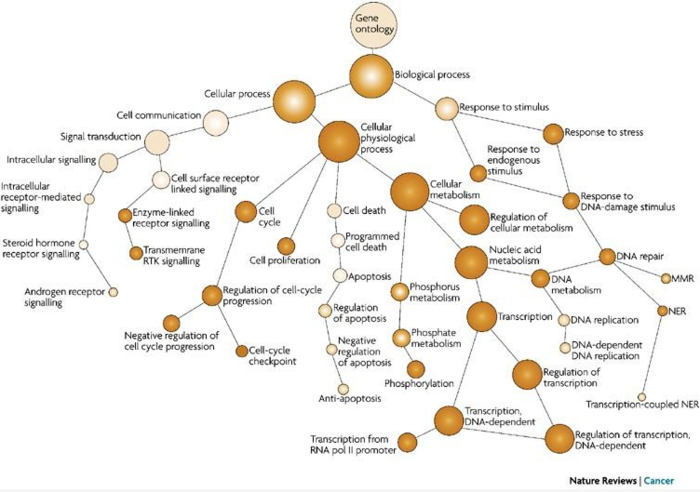
GO是按严格的生物学背景、采用统一的术语结构注释基因 及其产品的数据库,包含几千条术语,分为3大分支:分子功能(molecular function)、生物过程(biological process)和细胞组成(cellular component)。GO的每个分支是一幅有向无环图(DAG),含有大量节点(术语)和分支,越高层的节点代表的意义越广泛,越低层的节点代表的意义越狭隘。每个节点含有多个意义广泛的父项(parent terms)和多个意义具体的子项(children terms)。一个基阂能被多个术语注释,目前许多基因还未被GO数据库注释。如果某一基因被某特定节点A注释,则该基因将自动被A节点的所有祖项(ancestors terms)所注释。
2. KO基因通路注释
KO是由基因通路图构成的数据库,描述基因调控网络,含有4个层次的有向无环图,其中第3个层次直接对应KEGG基因通路。微阵列芯片上属于同一KEGG基因通路(KO分类)的基
因可定义为一个基因集。
3. ENTREZ基因间信息注释
ENTREZ是一个综合性的数据库,提供了基因和基因产物的大量信息,包含基因GO、KO信息,以及基因间相互作用信息四。ENTREZ采用统一格式对基因间相互信息进行注释。类似的数据库有BIND、BioGRID、EcoCyc和HPRD。
基因集可根据以上任一数据库的注释信息来定义,也可利用数据库交叉信息进行定义。换句话说,被同一GO或KO术语注释的基因町定义为一个基因集;整合GO、KO注释信息,同时也考虑来自ENTREZ的基因间相互作用信息,也町定义一个基因集。有研究者认为多数据库交叉信息定义的基因集更稳健,但采用单术语定义基因集简单易操作。

本文中为大家介绍一个R语言的包ABAEnrichment,这个R包可以用来检测在不同发育阶段的特定脑区上基因表达的富集度。该软件包融合了AllenBrainAtlas的表达数据以及大脑结构组织的本体论数据。
(http://bioconductor.org/packages/3.3/bioc/html/ABAEnrichment.html).
ABAEnrichment: an R package to test for gene set expression enrichment in the adult and developing human brain
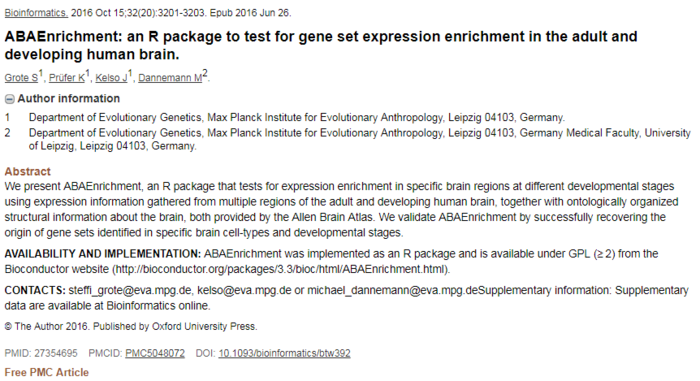
https://www.ncbi.nlm.nih.gov/pubmed/27354695
改文章目前被引用2次?
1.Detecting ancient positive selection in humans using extended lineage sorting **
http://www.biorxiv.org/content/early/2016/12/13/092999.full.pdf html
2.Excavating Neandertal and Denisovan DNA from the genomes of Melanesian individuals** (补充材料)
http://science.sciencemag.org/content/352/6282/235/tab-pdf
上述介绍的均为基因功能富集分析,这类分析常使用本体论的方法(例如基因本体论)对受基因影响的功能和表型进行深入研究。AllenBrainAtlas(ABA)计划提供了人脑多脑区、横跨多年龄段的基因表达信息(Allen Human Brain Atlas; human.brain-map.org and BrainSpan Atlas of the Developing Human Brain; brainspan.org)。因此,这些信息可以用来探究在特定脑区/特定发育阶段所涉及到的基因集。该软件包是目前为止第一个利用ABA数据库,采用本体论方法对候选基因在特定脑区/发育阶段的表达富集进行统计学分析的软件包。
富集分析首先需要对每个脑区进行基因注释,即将在这些脑结构上表达的基因分配到这些脑区上。该软件再分配之前会对基因的表达量卡一个阈值来划分表达与否。
具体处理方法如下所示。
基因表达数据
采用了ABA提供的两套数据:成人数据以及发育数据
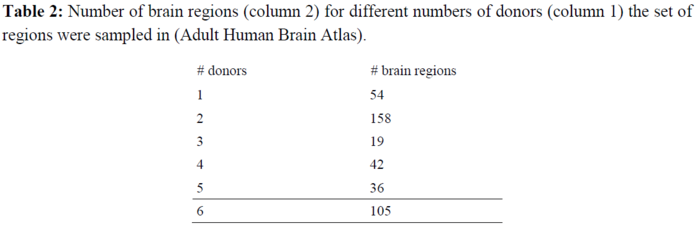
**1. 成年人基因表达数据: **来自六个成年人被试的微阵列数据(Microarray Survey, Oct. 2013 v.7),包含了414个脑区上大约16000个标准化的基因表达数据(Microarray Data Normalization, March 2013 v.1);
2. 发育基因表达数据:来自42个跨越31个不同发育阶段的被试的标准化后的RNA-Seq大约17000个基因的表达数据(RPKM, ‘RNA-Seq Gencode v10 summarized to genes\'),发育阶段范围为:出生后8周到40岁。26个脑区中,有16个区域有至少20个不同的年龄阶段的采样,其他10个脑区则只有少于5个不同发育阶段的表达数据。
基因表达数据的处理
**1. 成年人基因表达数据: **
某特定脑区上某特定基因的表达水平定义为:该基因所有的在该脑区的样本上所有探针测量的基因表达量的平均值。
2. 发育基因表达数据:
为了增加发育效应的统计检验的效力,发育数据仅针对上述提到的涵盖20个不同发育阶段的脑区进行分析。当检测发育效应时,某基因在某脑区某发育阶段的表达量定义为该脑区该阶段,所有样本基因的RNA-Seq表达量的均值。
本体论
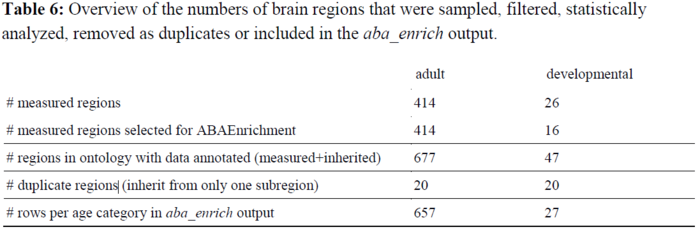
ABA提供了互相不覆盖的脑结构的本体论,发育数据集和成人数据集分别涵盖了3317和1534个脑区。
**1. 成年人基因表达数据: **
1534个脑区中,有414个脑区有直接的基因表达数据。其他没有直接的表达数据的脑区,若其任意一个子区域上有某给定表达的信息,则认为该基因在这个脑区上表达了。具体数量信息如下表所示。
上表中可见,在成人数据中,有直接测量得到的基因表达信息的脑区有414个;这些脑区加上通过本体论信息补充的(即从子区域中得到的信息)一共677个脑区;在通过脑结构本体论信息补充信息的区域中,有20个是冗余的,即,该区域只有一个子区域,且该子区域有表达信息。故,在富集分析的输出中,将共有657行对应所有有注释的脑区。
2. 发育基因表达数据:
如上图所示。一共47个脑区纳入分析。
富集分析
经过用户自定义的阈值筛选后,表达量高于阈值的的基因被注释到脑区。这个阈值默认为所有脑区上10%为补偿的表达分位数。接下来,软件调用aba_enrich 函数采用超几何检验或者是Wilcoxon-秩和检验进行富集分析。
软件实现
表达数据
软件包包含三种表达数据:
- 6个成年人的微阵列数据
- 42个被试横跨 5大不同发育阶段(胎儿、婴儿、儿童、青少年和成年人)的RNA-Seq数据
- 每个基因的发育分数:表示年龄对该基因的表达的效应。
这三个数据集都首先对编码蛋白的基因进行了筛选,然后,基因的表达量水平都在所有被试上的平均值。第三个数据集是一个衍生分数,并不包含基因表达信息。
脑区上基因的注释
基因注释采用了描述大脑结构层级构架的本体论信息。脑区被其上或其子结构上表达的所有基因注释。基因的表达与不表达是通过阈值来划分的,这个阈值是基因表表达量的百分数,并通过设置cutoff_quantiles的参数进行划分。比如,阈值设为0.4,意味着大脑中低于40%表达分位数的基因被认为“不表达”,而前60%的基因被认为“表达”。每个阈值下,都会进行独立的基因表达富集分析。默认为10%:10%:90%
富集分析
富集分析采用超几何检验或者是Wilcoxon-秩和检验进行富集分析(集成与FUNC软件中)。
- 超几何检验用来估计在每个脑区上,被注释(表达的)的候选基因相对于被注释的背景基因的富集程度。这里涉及到背景基因如何定义。背景基因可以默认的就非常简单的定义为所有编码蛋白的非候选基因,也可以用户指定。
- 相对于这种二分化的对候选基因和背景基因的定义方式,Wilcoxon-秩和检验引入了用户给基因自定义的分数。该检验可以检测每个脑区上分数高的基因集的富集。
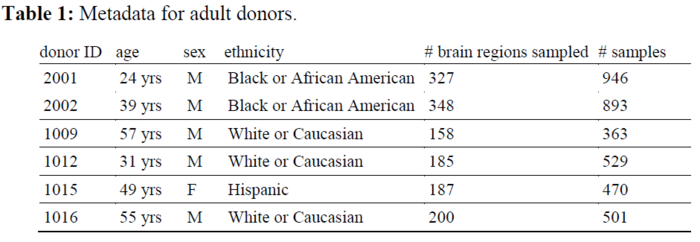
分析过程中不可避免涉及到多重比较的作用,软件包中采用了一种非参(随机集,置换检验?)的方法来对family-wise error进行控制。
随机集的产生方式(默认)通过将候选基因和背景基因进行置换(超几何检验),或是将基因分配的分数进行置换(Wilcoxon-秩和检验)。如流程图中所示。
超几何检验方法中,ABAEnrichment还提供了额外的选项,可以在置换过程中令背景基因被随机选为候选基因的概率与该背景基因的长度成正比(gene_len选项)。
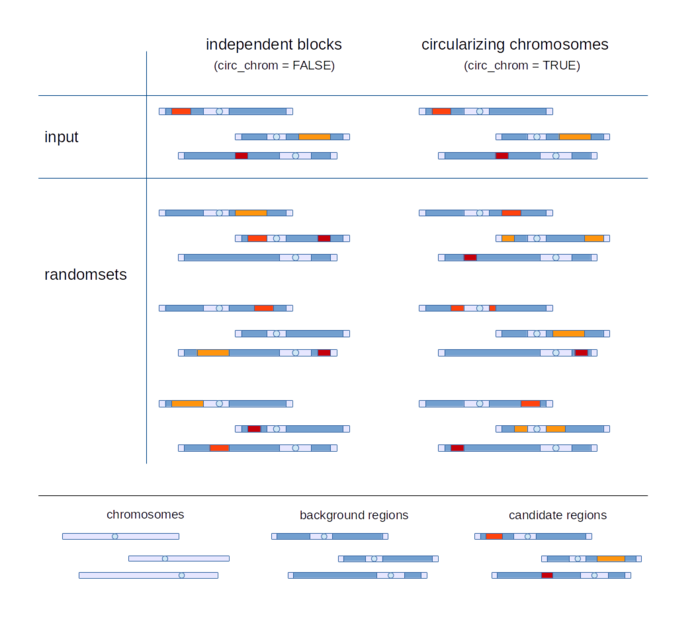
除了这种指定候选单个基因的方式,也可以选取整个基因区域作为输入。如下图所示,软件检测所选候选基因区域相对于背景基因区域在脑区上的富集程度。此时,有两种产生随机集的方式(选项circ_chrom): - (默认)背景区域中随机选取一个连续block,作为新的候选基因。(可位于与候选区域不同的染色体)
- 在位于候选区域的同一条染色体上的背景区域中选取一个区域作为新的候选基因。这是不必为连续的block。
ABAEnrichment中包含的函数
| 函数 | 描述 |
|---|---|
| aba_enrich | 进行富集分析的核心函数 |
| get_expression | 返回给定基因集在给定脑区上的表达值 |
| plot_expression | 画出给定基因集在给定脑区上的表达值的heatmap图 |
| get_name | 返回指定脑结构ID的全名 |
| get_sampled_substructures | 返回给定脑区上有表达数据的子结构 |
| get_superstructures | 返回给定脑区的上层结构 |
| get_id | NEW:返回给定名字脑区的结构ID |
| get_annotated_genes | NEW:返回富集的脑区或者是用户指定的脑区上注释的基因 |
程序示例
这里仅介绍使用超几何检验方法检测基因表达富集方法
设定一个候选基因集(包含13个基因),试图找到这些候选基因的表达究竟富集在哪些脑区上。分别采用成年人数据和5个发育阶段的发育数据。定义候选基因的方法是采用二值化定义的方法,0标记为背景基因,1标记为候选基因。基因的名字可以通过不同的基因标识进行定义 (Entrez-ID, Ensembl-ID or gene-symbol)。例子中没有特别指定背景基因,因此全部编码蛋白的基因都被选为背景基因。
## load ABAEnrichment package
library(ABAEnrichment)
## create input vector with candidate genes
gene_ids = c(\'NCAPG\', \'APOL4\', \'NGFR\', \'NXPH4\', \'C21orf59\', \'CACNG2\', \'AGTR1\', \'ANO1\',
\'BTBD3\', \'MTUS1\', \'CALB1\', \'GYG1\', \'PAX2\')
genes = rep(1, length(gene_ids)) #genes变量保存一列1来标记候选基因
names(genes) = gene_ids
genes
输出:
##    NCAPG    APOL4     NGFR    NXPH4 C21orf59   CACNG2    AGTR1     ANO1    BTBD3    MTUS1    CALB1     GYG1
##        1        1        1        1        1        1        1        1        1        1        1        1
##     PAX2
##        1
aba_enrich函数用来进行核心的富集分析。其输入为genes向量,并用dataset选项指定用于计算的数据集,默认为adult,另外可指定为5_stages。
## run enrichment analyses with default parameters for the adult and developing human brain
res_adult = aba_enrich(genes, dataset=\'adult\')
res_devel = aba_enrich(genes, dataset=\'5_stages\')
下面示例设置初始阈值。cutoff_quantiles 和 n_randsets的默认值为seq(0.1,0.9,0.1)和1000
## run enrichment analysis with less cutoffs and randomsets to save computation time
res_devel = aba_enrich(genes, dataset=\'5_stages\', cutoff_quantiles=c(0.5,0.7,0.9), n_randsets=100)
aba_enrich返回结果为一个列表res_devel,其第一个元素包含了每个脑区和年龄分组的统计分析的结果(每个年龄分组内,独立进行的分析)
## extract first element from the output list, which contains the statistics
fwers_devel = res_devel[[1]]
## see results for the brain regions with highest enrichment for children (3-11 yrs, age_category 3)
fwers_3 = fwers_devel[fwers_devel[,1]==3, ]#3表示年龄分类3
head(fwers_3)
##    age_category structure_id                                     structure times_FWER_under_0.05 mean_FWER
## 55            3  Allen:10657                         CBC_cerebellar cortex                     0 0.5000000
## 56            3  Allen:10361                        AMY_amygdaloid complex                     0 0.9500000
## 57            3  Allen:10163    M1C_primary motor cortex (area M1, area 4)                     0 0.9566667
## 58            3  Allen:10225 IPC_posteroventral (inferior) parietal cortex                     0 0.9733333
## 59            3  Allen:10173            DFC_dorsolateral prefrontal cortex                     0 0.9833333
## 60            3  Allen:10161                         FCx_frontal neocortex                     0 0.9866667
##    min_FWER                                       equivalent_structures          FWERs
## 55     0.36 Allen:10657;Allen:10656;Allen:10655;Allen:10654;Allen:10653 0.66;0.48;0.36
## 56     0.85                                                 Allen:10361       0.85;1;1
## 57     0.87                                     Allen:10163;Allen:10162       0.87;1;1
## 58     0.92                                     Allen:10225;Allen:10214       0.92;1;1
## 59     0.96                                                 Allen:10173    0.96;1;0.99
## 60     0.96                                                 Allen:10161       0.96;1;1
结果的列分别为age_category,脑区相关信息, times_FWER_under_0.05, min_FWER 和mean_FWER。例如,min_FWER 为在所有阈值下,在该脑区表达的候选基因富集度的最小FWER值。FWER列则列出了所有阈值下的FWER值。
equivalent_structures列中列出了与该脑区具有相同表达模式的其他区域,这是因为这些区域之间存在依赖性,并不完全独立。节点(脑区)从他的本体论中的子节点(子区域)上遗传基因表达与否,如果某个区域只有一个子节点表达,则该父节点继承了唯一子节点的表达后,即具有跟子节点完全相同的遗传信息。
除了统计的结果之外,aba_enrich也给出了候选基因中有哪些通过阈值被划分为表达(若在所有脑区上均没有通过阈值则不出现。)。
res_devel[2:3]
## $genes
##    AGTR1     ANO1    BTBD3 C21orf59   CACNG2    CALB1     GYG1    MTUS1    NCAPG     NGFR    NXPH4     PAX2
##        1        1        1        1        1        1        1        1        1        1        1        1
##
## $cutoffs
##     age_category_1 age_category_2 age_category_3 age_category_4 age_category_5
## 50%       3.144481       2.854802       2.716617       2.776235       2.862117
## 70%       7.823920       7.017616       6.897414       6.842193       7.118609
## 90%      23.768641      22.478328      23.124388      21.625395      22.680811
如,在年龄分类2中(婴儿),当cutoff值为0.7(70%)时,在某个脑区中,基因表达值超多7.017616才会被认为是表达了。
展示表达数据
get_expression
可以输出基因在脑区上的表达值(所有被试平均)。可以直接选取富集分析的结果中的脑区,例如:
## get expression data for the first 5 brain regions from the last aba_enrich-analysis
top_regions = fwers_region[1:5, \'structure_id\']#通过指定structure_id直接拉取脑区信息
top_regions
## [1] "Allen:4671" "Allen:12926" "Allen:4734" "Allen:4738" "Allen:12909"
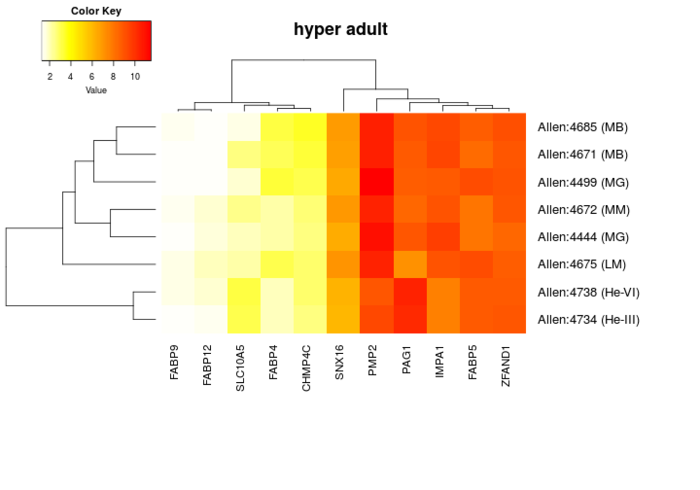
expr = get_expression(top_regions, background=FALSE)
head(expr)
##              CHMP4C   FABP12    FABP4    FABP5    FABP9    IMPA1      PAG1      PMP2  SLC10A5    SNX16
## Allen:4671 3.315379 1.322007 2.948199 8.331502 1.289105 9.367726  8.846593 10.507419 2.517208 6.726171
## Allen:4675 2.784213 1.969504 3.043131 9.223920 1.588357 8.954029  7.125901 10.477008 2.137033 7.080715
## Allen:4672 2.645451 1.744787 2.177720 7.968980 1.448837 9.034155  8.390096 10.483289 2.437719 6.958238
## Allen:4444 2.586348 1.648789 2.129794 7.979775 1.358975 9.586679  8.861224 11.058100 1.990756 6.375037
## Allen:4499 3.086266 1.302643 3.250694 9.242289 1.293894 8.830867  8.682235 11.506694 1.704897 6.400059
## Allen:4734 2.518846 1.477751 1.987022 8.811209 1.377784 7.703972 10.205105  9.345247 3.046310 6.080289
##              ZFAND1
## Allen:4671 8.877031
## Allen:4675 8.722243
## Allen:4672 8.863811
## Allen:4444 8.401070
## Allen:4499 8.977492
## Allen:4734 8.870895
上述代码中,若将选项background=FALSE则不输出背景基因的信息,否则会输出背景基因的信息。
除了通过富集的结果指定基因和脑区,还可以通过用户指定的方式进行设置。
## get expression data independent from previous aba_enrich analysis
regions = c(\'Allen:12926\', \'Allen:4738\', \'Allen:4671\', \'Allen:12909\', \'Allen:4718\') #指定脑区
gene_ids = c(\'CHMP4C\', \'FABP12\', \'FABP4\', \'FABP5\', \'FABP9\', \'IMPA1\',
  \'PAG1\', \'PMP2\', \'SLC10A5\', \'SNX16\', \'ZFAND1\')  #指定基因
expr2 = get_expression(regions, gene_ids=gene_ids, dataset=\'adult\', background=FALSE)
plot_expression
可以对表达数据进行可视化。函数的使用方法和上一个差不多,也可以通过只指定脑区,然后用富集分析的结果做为输入。
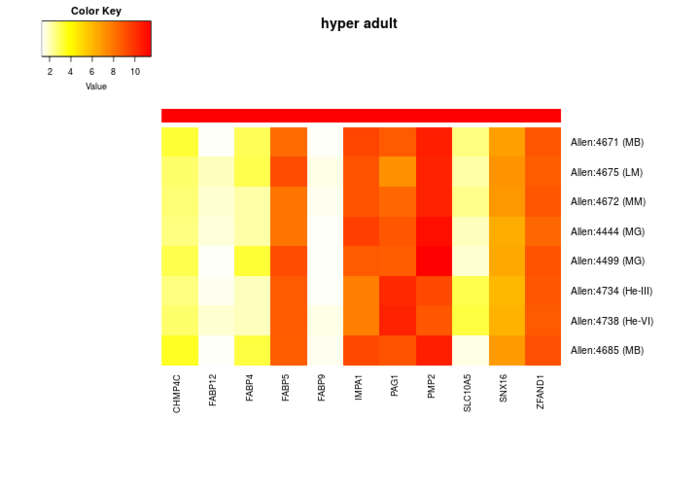
## get expression data for the first 5 brain regions from the last aba_enrich-analysis
top_regions = fwers_region[1:5, \'structure_id\']
plot_expression(top_regions, background=FALSE)
## plot the same expression data without dendrogram 不画树形图
plot_expression(top_regions, dendro=FALSE, background=FALSE)
也可以单独使用函数画图。
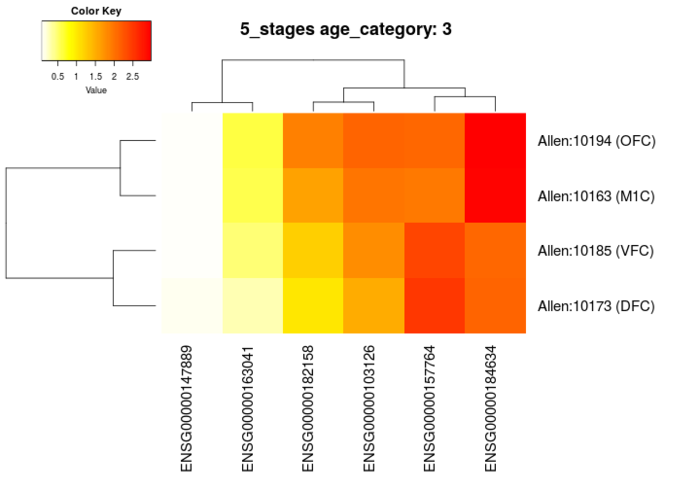
## plot expression of some genes for the frontal neocortex (Allen:10161) in age category 3 (children, 3-11 yrs)
gene_ids = c(\'ENSG00000157764\', \'ENSG00000163041\', \'ENSG00000182158\', \'ENSG00000147889\',
  \'ENSG00000103126\', \'ENSG00000184634\')
plot_expression(\'Allen:10161\', gene_ids=gene_ids, dataset=\'5_stages\', age_category=3)
代码中选取的脑区为frontal neocortex (Allen:10161),该脑区没有直接的表达数据,但是其子结构具有表达数据。画出的图中,为这些子结构分开的结果。
get_name, get_sampled_substructures and get_superstructures
上个例子中我们发现,frontal neocortex (Allen:10161)这个脑区其实在数据集中没有基因表达的数据,而其一些子区域具有表达数据。ABAEnrichment软件提供了一些函数可以供用户查看脑结构本体论图,这个图可以表征脑区之间的层次结构组成,这个层次结构也用在了富集分析中(类似功能富集中的层次结构的树形网络)。get_sampled_substructures函数可以返回结构ID对应的脑区的所有子结构(有表达数据的)。get_superstructures函数则可以返回所有上级脑区。get_name函数则可以用来得到ID对应的脑区的名字。
## get IDs of the substructures of the frontal neocortex (Allen:10161) for which expression data are available
subs = get_sampled_substructures(\'Allen:10161\')
subs
## [1] "Allen:10173" "Allen:10185" "Allen:10194" "Allen:10163"
## get the full name of those substructures
get_name(subs)
##                                  Allen:10173                                  Allen:10185
##         "DFC_dorsolateral prefrontal cortex"        "VFC_ventrolateral prefrontal cortex"
##                                  Allen:10194                                  Allen:10163
##                 "OFC_orbital frontal cortex" "M1C_primary motor cortex (area M1, area 4)"
## get the superstructures of the frontal neocortex (from general to special)
supers = get_superstructures(\'Allen:10161\')
supers
## [1] "Allen:10153" "Allen:10154" "Allen:10155" "Allen:10156" "Allen:10157" "Allen:10158" "Allen:10159"
## [8] "Allen:10160" "Allen:10161"
## get the full names of those superstructures
get_name(supers)
##                    Allen:10153                    Allen:10154                    Allen:10155
##              "NP_neural plate"               "NT_neural tube"                     "Br_brain"
##                    Allen:10156                    Allen:10157                    Allen:10158
## "F_forebrain (prosencephalon)" "FGM_gray matter of forebrain"            "Tel_telencephalon"
##                    Allen:10159                    Allen:10160                    Allen:10161
##           "Cx_cerebral cortex"    "NCx_neocortex (isocortex)"        "FCx_frontal neocortex"
NEW: get_id
可用于在本体论中寻找结构名称对应的ID
## get structure IDs of brain regions that contain \'accumbens\' in their names
get_id(\'accumbens\')
##                      structure ontology structure_id
## 1        Acb_Nucleus Accumbens    adult   Allen:4290
## 2  Acb_Nucleus Accumbens, Left    adult   Allen:4291
## 3 Acb_Nucleus Accumbens, Right    adult   Allen:4292
## get structure IDs of brain regions that contain \'telencephalon\' in their names
get_id(\'telencephalon\')
##           structure      ontology structure_id
## 1 Tel_telencephalon developmental  Allen:10158
## 2 Tel_Telencephalon         adult   Allen:4007
## get all brain regions included in ABAEnrichment together with thier IDs
all_regions = get_id(\'\')
head(all_regions)
##                      structure      ontology structure_id
## 1              NP_neural plate developmental  Allen:10153
## 2               NT_neural tube developmental  Allen:10154
## 3                     Br_brain developmental  Allen:10155
## 4 F_forebrain (prosencephalon) developmental  Allen:10156
## 5 FGM_gray matter of forebrain developmental  Allen:10157
## 6            Tel_telencephalon developmental  Allen:10158
NEW: get_annotated_genes
可以用来得到注释到某脑区的基因集。(即超过阈值,被认为表达的基因)。可以通过aba_enrich(...)[[3]],表达值可以通过得到get_expression得到,也更方便的通过get_annotated_genes直接得到。函数将aba_enrich函数的输出结果和FWER的一个阈值(默认0.5)作为输入,并返回所有脑区/表达阈值组合下,小于FWER阈值的有注释的基因
、FWER以及哪些是候选基因的信息。
## run an enrichment analysis with 7 candidate and 7 background genes for the developing brain
gene_ids = c(\'FOXJ1\', \'NTS\', \'LTBP1\', \'STON2\', \'KCNJ6\', \'AGT\',
  \'ANO3\', \'TTR\', \'ELAVL4\', \'BEAN1\', \'TOX\', \'EPN3\', \'PAX2\', \'KLHL1\')
genes = rep(c(1,0), each=7)
names(genes) = gene_ids
res = aba_enrich(genes, dataset=\'5_stages\', cutoff_quantiles=c(0.5,0.7,0.9), n_randsets=100)
head(res[[1]])
##   age_category structure_id                               structure times_FWER_under_0.05 mean_FWER min_FWER
## 1            1  Allen:10294 HIP_hippocampus (hippocampal formation)                     0 0.4566667     0.32
## 2            1  Allen:10398      MD_mediodorsal nucleus of thalamus                     0 0.8266667     0.61
## 3            1  Allen:10361                  AMY_amygdaloid complex                     0 0.8900000     0.67
## 4            1  Allen:10331                      CN_cerebral nuclei                     0 0.8900000     0.67
## 5            1  Allen:10159                      Cx_cerebral cortex                     0 0.9500000     0.85
## 6            1  Allen:10158                       Tel_telencephalon                     0 0.9500000     0.85
##                                         equivalent_structures          FWERs
## 1                         Allen:10294;Allen:10293;Allen:10292 0.67;0.38;0.32
## 2 Allen:10398;Allen:10397;Allen:10391;Allen:10390;Allen:10389    0.87;1;0.61
## 3                                                 Allen:10361       0.67;1;1
## 4                                                 Allen:10331       0.67;1;1
## 5                                                 Allen:10159       0.85;1;1
## 6                                                 Allen:10158       0.85;1;1
## see which candidate genes are annotated to brain regions with a FWER < 0.01
anno = get_annotated_genes(res, fwer_threshold=0.1)
anno
##   age_category structure_id cutoff anno_gene FWER score
## 1            5  Allen:10333    0.5       AGT 0.07     1
## 2            5  Allen:10333    0.5      ANO3 0.07     1
## 3            5  Allen:10333    0.5     LTBP1 0.07     1
## 4            5  Allen:10333    0.5     STON2 0.07     1
同样也可以直接指定脑区、表达阈值和基因。
如果指定了基因集,则只输出此基因集中的基因的表达信息,否则将输出所有编码蛋白的基因的信息。
## find out which of the above genes have expression above the 70% and 90% expression-cutoff, respectively,
## in the basal ganglia of the adult human brain (Allen:4276)
anno2 = get_annotated_genes(structure_ids=\'Allen:4276\', dataset=\'adult\',
  cutoff_quantiles=c(0.7,0.9), genes=gene_ids)
anno2
##   age_category structure_id cutoff anno_gene
## 1            5   Allen:4276    0.7       AGT
## 2            5   Allen:4276    0.7      ANO3
## 3            5   Allen:4276    0.7       TTR
## 4            5   Allen:4276    0.9       AGT
## 5            5   Allen:4276    0.9      ANO3
## 6            5   Allen:4276    0.9       TTR